-1.jpg?width=780&height=532&name=www.greyparrot.aihubfsGreyParrot-facility-monitoring-IFAT-newsroom%20(1)-1.jpg)
Greyparrot Analyzer is helping Omrin, whose sorting facility processes over 300,000 tonnes of residual waste a year, monitor the quality of its mixed-plastics stream in real time - and pinpoint an unexpected, recurring cause of quality dips that were putting the facility at risk of financial penalties.
Why quality monitoring matters at Omrin
At Omrin's mixed waste sorting facility in the Netherlands, household material is processed to recover ferrous, non-ferrous and a large volume of plastics. Two optical sorters produce a mixed-plastics stream that travels on to reprocessor KSI for further sorting.
For process technologist Karin Wolters, the quality of that stream carries direct financial stakes. Output has to hold at a consistent purity level, and Verpact, the Netherlands' producer responsibility organisation for packaging, issues penalties when it falls short. Historically, quality was verified through manual sampling — a resource-intensive process that captures only a tiny fraction of the material, and one that surfaces problems long after they happen.
Being a technologist, Karin didn't take automated data on trust. She ran her own manual analysis alongside the Analyzer first, validating the numbers before relying on them:
"I'm a technologist who really needs facts to believe something works. So I make sure that all the figures are right."
- Karin Wolters, Process Technologist at Omrin
Usefully, KSI runs the same Greyparrot system on their infeed - so both facilities read from a shared, continuous source of truth for the stream that passes between them.
Spotting a pattern manual sampling would miss
With a continuous record rather than a handful of samples, Karin could see her output quality was stable — until, at specific moments, it wasn't:
"I noticed that my quality is very stable, but on certain points it just dropped down. Okay, what's happening here?"
Because Omrin and KSI compare data every two weeks, she could trace the consequences downstream. The moments her quality dropped were the same moments KSI ran into trouble processing the material. The question was no longer whether quality was dropping, but why.
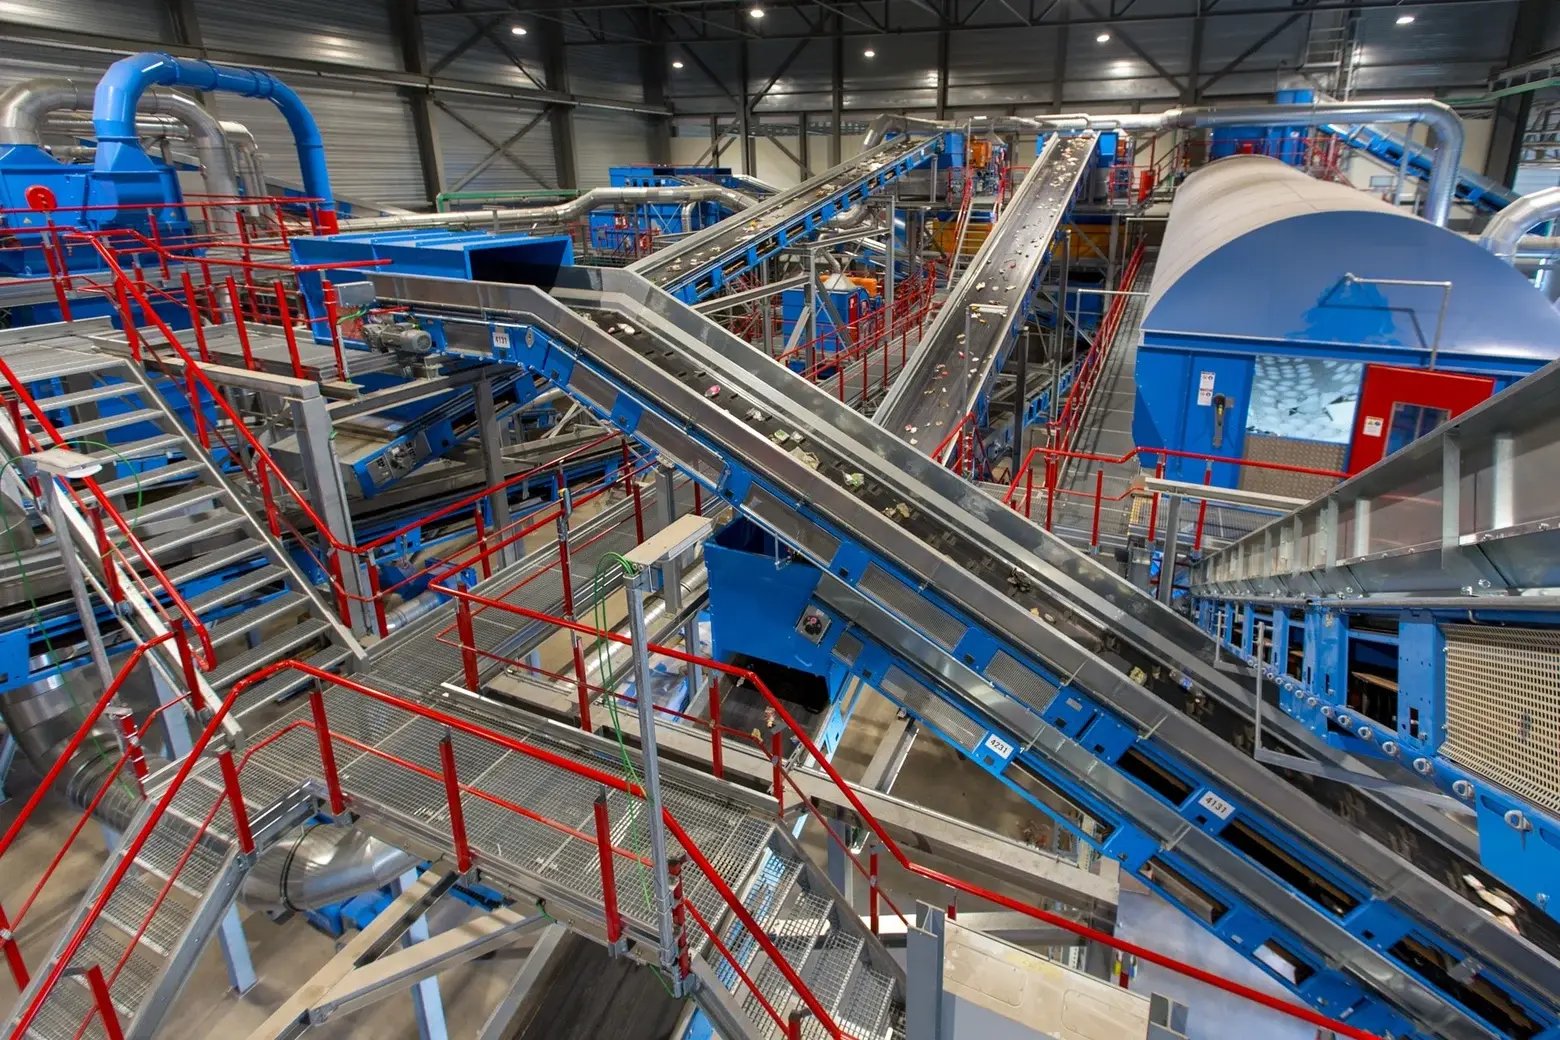 KSI facility
From a quality dip to a root cause
Continuous data let Karin line the dips up against everything else happening in the process. The correlation was unambiguous — the quality drop followed the recalibration of the optical sorter:
"Whenever the quality in our camera system drops, it's because the optical sorter has just been calibrated. So we know that is affecting the quality of the material we send to KSI."
A weekly service and recalibration on adjacent NIR equipment was quietly degrading the quality of Omrin's outgoing stream. A 1% sampling regime would almost certainly have missed it - a recurring weekly dip only becomes visible when the data is continuous enough to reveal the rhythm.
The Analyzer's classification depth mattered here too. Karin wasn't limited to a target-versus-non-target split; she could see exactly what the non-target material was, down to categories like sanitary items - turning a quality number into a problem she could diagnose object by object.
Turning data into a conversation the supplier can act on
Identifying a cause is one thing; getting an equipment supplier to act on it is another - especially when the finding points back at their own service process. A validated, continuous dataset changes that conversation. Karin can now show the dip follows calibration every week without exception, and she's preparing to take that evidence to the supplier directly. It's a level of scrutiny that simply isn't available from periodic manual checks.
Building the case for a smarter facility
Omrin is already using the data from its Analyzer units to inform the design of a new facility — and quality monitoring is part of that picture. For Karin, the shift is fundamental:
"You don't need 10,000 operators. You need data, and you need operators who can read the data."
The wider lesson for operators is about where quality problems actually live. Karin's dips weren't caused by her feedstock or her own process settings - they were introduced by a maintenance routine on neighbouring equipment. Without continuous visibility across the output, that cause would have stayed invisible, and the penalties would have looked like a problem to solve in the wrong place.
That's the shift real-time quality data enables: from finding out you have a problem when the penalty arrives, to seeing it form, tracing it to its source, and resolving it with evidence in hand. As Karin and her counterparts at KSI have found, two facilities reading from the same data can troubleshoot a shared stream together - closing a loop that manual sampling leaves open.
---
What would you change if you could see everything on the belt?
Step into the director's seat, watch your KPIs react in real time, and see what continuous data catches that sampling misses.

.png?width=501&height=285&name=3.%202026-team-fun-photo%20(1).png)