Improve your Overall Equipment effectiveness (OEE): more uptime, more tonnes, more margin

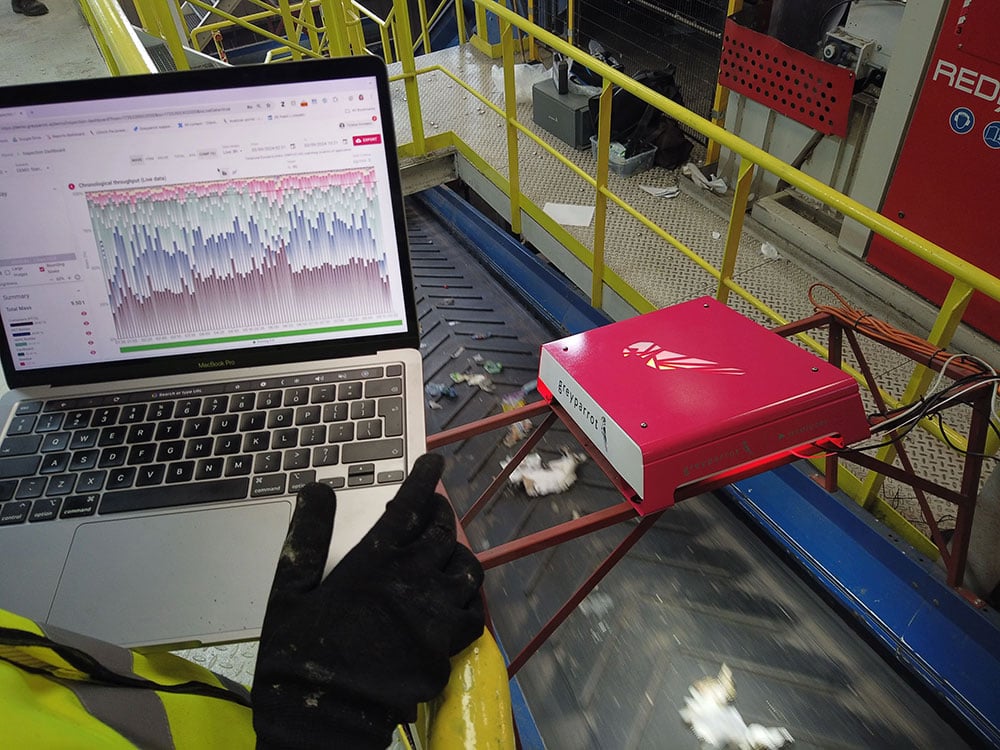
Greyparrot Analyzer measures every stream in your facility and scores availability, performance and quality as the shift runs, so problems get dealt with on the day, not found in next week's report.

Running in facilities operated by:


Biffa
KSI
Re-Gen
Veolia
Greenback
Bollegraaf
Green Tech
Cheshire West Recycling
Amcor
Republic Services
USA Waste & Recycling
WM
fcc

THE CHALLENGES WE SOLVE

What MRF operators tell us keeps them up at night

Plants that work out OEE from manual logs are typically 8 to 15 points away from the real figure. Here's why.

01

You're reacting 24-48h too late

By the time a manual sample picks up a purity drop, a whole shift of material has already gone through. The problem has usually been building for hours before anyone knows about it.

Greyparrot solution

Live quality tracking & alerts

02

Equipment, throughput, and uptime run on guesswork

Whether it's sorter settings, belt idle time or the business case for a new optical sorter, most of these calls get made on gut feel and the odd sample. And the feedstock keeps changing underneath you.

Greyparrot solution

Availability & performance, measured live

03

Manual sampling is slow, costly, and leaves audit gaps

Operators spend hours handling waste by hand and still cover less than 1% of throughput. The same samples feed PRO and regulatory reporting, so you're paying in staff time, fees and safety risk, and still have gaps between audits.

Greyparrot solution

Continuous AI monitoring & automated reporting

Value calculator

What's a Greyparrot deployment worth to you?

Set your throughput and the number of monitored lines. We'll calculate the value Greyparrot would unlock at your facility.

Estimated annual value
£—/yr
Adjust the sliders below to see your range
Optimise throughput & uptime
US MRF · +20% uptime
£—
Capture residue valuables
UK MRF · 50% residue recoverables
£—
Protect output purity
EU MRF · purity drop fixed in 12-min
£—
Reduce manual sampling
EU PRF · 66h/m sampling labour per line
£—
How this is calculated +

Every figure is derived from documented Greyparrot customer outcomes. The calculator scales each scenario by your throughput and monitored-line count using these formulas:

Optimise throughput & uptime
Monitored share of throughput × 4% uplift × £/tonne material value
Optimise throughput & uptime
Capture residue valuables
Throughput × 15% residue rate × 50% recoverable × 30% realistic capture × £/tonne × line multiplier
Source: UK MRF case where 50% of residue line material was found to be recoverable.
Protect output purity
(Monitored lines − 2) × 0.8 catches per year × £47k saved per catch × throughput factor
Source: European MRF — purity drop diagnosed in 12 minutes via Analyzer alert, vs ~38 hours via manual spot sampling. £47k = avoided reprocessing cost.
Reduce manual sampling
Monitored lines × £11,880/year baseline × throughput factor
Source: EU PRF documented 66+ hours per month per line of manual sampling labour eliminated.

Blended material value defaults to £140/t. The three multiplier factors (line multiplier, throughput factor, monitored share) calibrate each scenario for facility size — smaller facilities use the conservative end of each range. These are directional ranges, not committed savings; your actual numbers depend on material mix, recovery targets, and operating patterns.

Directional estimate calibrated against six documented Greyparrot deployments. Your actual numbers depend on material mix, recovery targets, and operating patterns — pressure-test them in a 30-minute facility review.
Get your tailored estimate →

WASTE INTELLIGENCE

Three ways waste intelligence improves your OEE

OEE is availability × performance × quality. Continuous waste analytics improves all three, and the return grows with every line you monitor.

01. RESPONSIVE OPERATIONS

Act on problems in minutes, not the next day

OEE lever: Quality


Alerts go out the moment contamination, purity or throughput moves out of range, not 24-48 hours later when the sample comes back. Operators can sort it before it reaches the bale, the offtaker or the contract.

  • £47,000 saved in one incident, purity drop diagnosed in 12 minutes
  • +200 tonnes/month (+9% production) via throughput & blending alerts
  • Email and SMS alerts, operators act wherever they are

£47,000

saved in a single incident through real-time purity alerting

02. OPTIMISATION

Maximise equipment, throughput, and uptime

OEE lever: Availability and performance


See how each sorter is running against its design rate, catch jams and "black belt" idle time while they're still building, and put real before-and-after numbers behind the next upgrade.

  • Residue mass reduced 17% after data-led optical sorter recalibration
  • Black belt idle time cut from ~5h to ~2h per shift, 110–190 extra tonnes per shift
  • Unrecovered material value reduced 20% post-optimisation

£408k/yr

annual saving after data-led sorter & throughput optimisation

03. CONTINUOUS MONITORING

Reduce manual sampling for operations and compliance

OEE lever: One source for all three


Most plants pull OEE together after the shift, from the weighbridge, the downtime log and the last bale audit. Analyzer measures all of it continuously, across 100% of throughput, with a timestamp on every reading for PRO, regulator and customer reporting.

  • £11,880/year saved on a single product line (UK MRF)

  • H&S risk eliminated, no staff contact with waste samples

  • Audit-ready composition data for PRO, regulators, and customer contracts

£11,880

annual saving per residue line, plus compliance reporting for free

FACILITY RESULTS

Deployed in facilities like yours

Re-Gen
regen black
Threshold alerts

OPERATORS ACT BEFORE OUTPUT QUALITY DROPS

"By arming plant managers with that information, they can now set thresholds or alerts, and say there's too much hard plastic arriving on this line, then make adjustments."

Conor-McCooey (1)

Conor McCooey

CIO, Re-Gen

KSI
ksi-black
Smarter operations

TECHNOLOGY ENHANCING TEAMS, NOT REPLACING THEM

"Greyparrot's dashboard helps us unlock insights that sharpen our operations. We utilise technology to enhance our team's efforts and maximise potential of existing resources."

foppe-jan-de-meer

Foppe-Jan de Meer

Plant Manager, KSI Recycling

EVIDENCE

Real outcomes from real facilities

Optimisation · Optical sorting

−17% residue mass per day

A recovery facility used Greyparrot to trial optical sorter configurations across four test periods. Baseline settings outperformed all alternatives. Post-recalibration, average daily residue fell from 54.5t to 45.3t, saving £310,000 in disposal costs annually and recovering 20% more unrecovered material value.

Responsive operations · Purity alert

12 min to diagnose a £47,000 problem

A control room operator spotted a purity drop on the live Greyparrot dashboard. Investigation revealed liquid from bottles had obscured an optical sorter sensor. Cleaned, restarted, purity restored. Without real-time alerting, the issue would have gone unnoticed until the next manual sample, costing up to £47,000.

Responsive operations · Throughput

+200t per month production uplift

Green Tech (Lithuania) deployed a single Analyzer on an infeed line to a PET wash process. By using throughput and blending alerts to optimise infeed composition in real time, they increased total production by 200 tonnes per month, a 9% uplift from one unit on one line.

NOT READY FOR A DEMO YET?

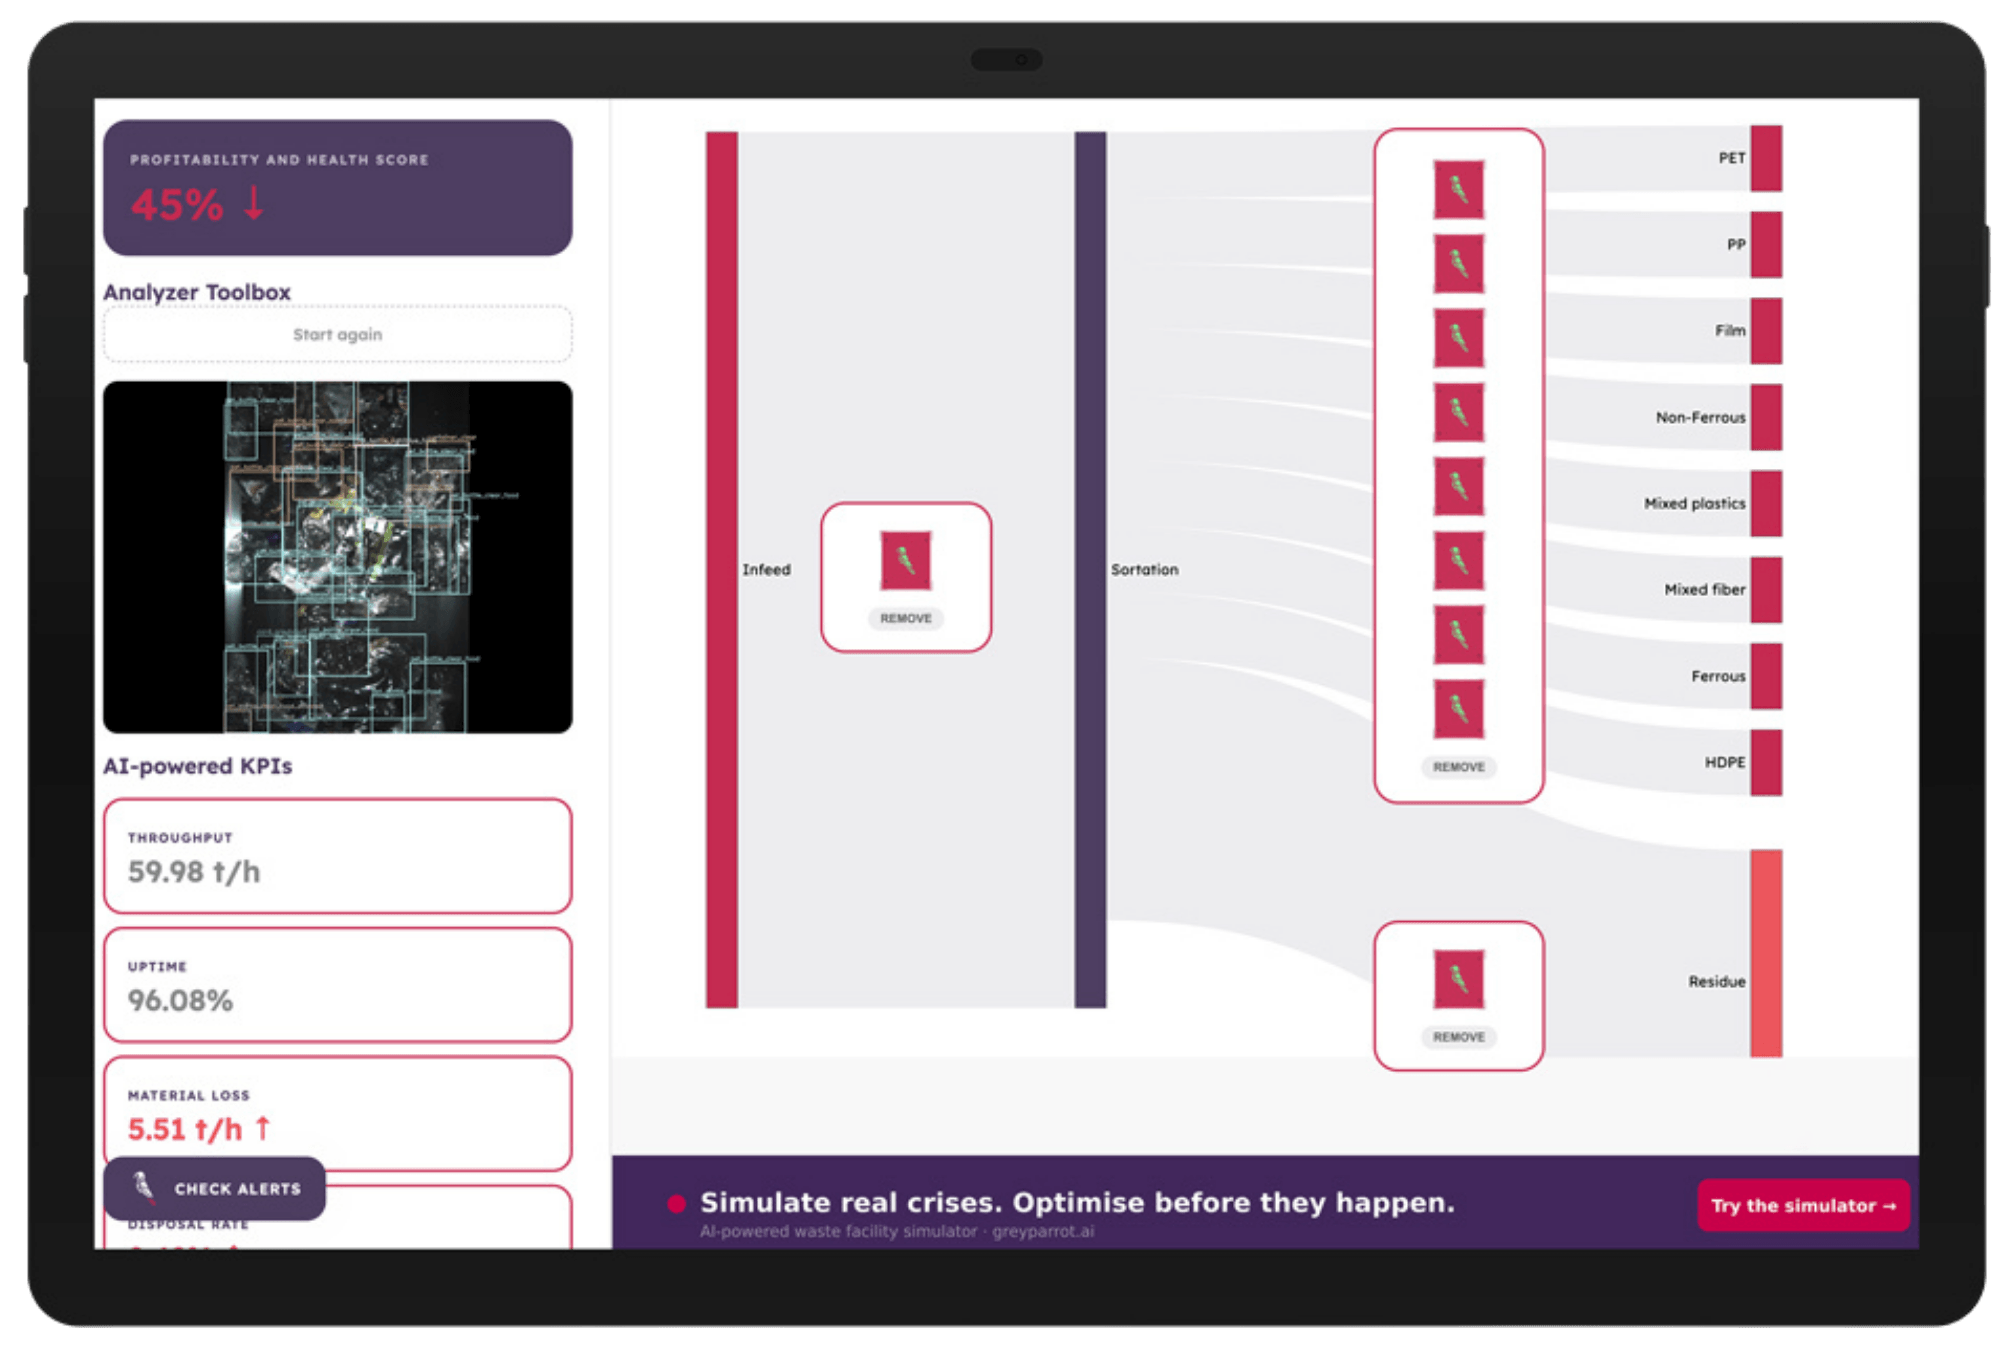
Explore the AI facility simulator in 8 minutes

The simulator puts you in control of a working facility. Work through three real-world MRF scenarios, a PET line issue, a supplier-change contamination event, and a throughput vs purity decision, and see how Greyparrot data changes the outcome.

facility simulator

KEY USERS

Waste intelligence in the hands of every role

Everyone works from the same numbers. Operators tend to check them daily, plant managers weekly and senior leadership monthly. Here's what each team uses the portal for.

Control room · Shift supervisors · Line operators

01. Operations team

Are we hitting throughput and recovery targets, and where are we losing time today?


THE CHALLENGE

 
Hit throughput and recovery targets and keep availability up, on feedstock that changes from one hour to the next, without putting anyone at risk.

THE ANALYZER PORTAL
  • OEE | Availability, performance and quality for this shift, what changed them, and AI insights on what to do about it
  • Alerts & KPIs | Set site-specific KPIs and get a live alert the moment a belt or line shifts
  • Reporting | Automated reports for compliance and operations review

Process engineers · Maintenance · Capex planning

02. Engineering team

Is our equipment performing, and how do we prove the ROI of the next upgrade?


THE CHALLENGE
 

Know whether each sorter is running at its design rate, see what a change did as soon as you make it, and have the numbers ready when the next upgrade needs signing off.


THE ANALYZER PORTAL
  • Performance | Benchmark each sorter against design capacity and catch drift early
  • Availability | Trace jams, blockages and unplanned downtime back to a section of the line
  • Optimise | See the impact of every process change live, and build the ROI case for upgrades with before/after numbers

Trading · Customer accounts · Vendor management

03. Commercial team

Which suppliers, customers and product runs are actually making us money?


THE CHALLENGE
 
Margins move with end markets and supplier quality. You need to know which contracts make money and be able to show a customer the purity they're paying for.

THE ANALYZER PORTAL
  • Inbound | Check inbound material against contracted spec
  • Output | Verify product purity before it leaves your gate
  • Margins | See run profitability line by line, separating what the plant did from what commodity prices did
  • Data | Integrate Analyzer data with your ERP and trading systems
ALSO USED BY
 
Plant managers · Sustainability & compliance leads · Innovation & multi-site teams · Senior leadership & board reporting · External auditors

Support from installation to insight 

Our engineers and data analysts stay involved after installation. Every team is onboarded and trained on the portal, dashboards and alerts are set up around your KPIs and shift patterns, and we review the OEE data with you regularly to find the next thing worth fixing.

Greyparrot

FREQUENTLY ASKED QUESTIONS

Things MRF operators ask us most often

Practical answers to the questions we get from operators evaluating Greyparrot. Tap any question to copy a direct link.

See Greyparrot in your facility

Book a 30-minute demo, or explore the AI facility simulator to see how data-driven decisions protect your margins before you commit.