Where waste data becomes actionable insight

The Analyzer portal turns raw data into clear, actionable insight, giving the teams who run a facility what they need to make the right call: operations, engineering, quality and commercial, all in one place.

250+ Analyzer units active         20+ countries deployed         111+ material categories         ISO 27001 + Cyber Essentials

clock-time-eight-outline_magenta

React in real time

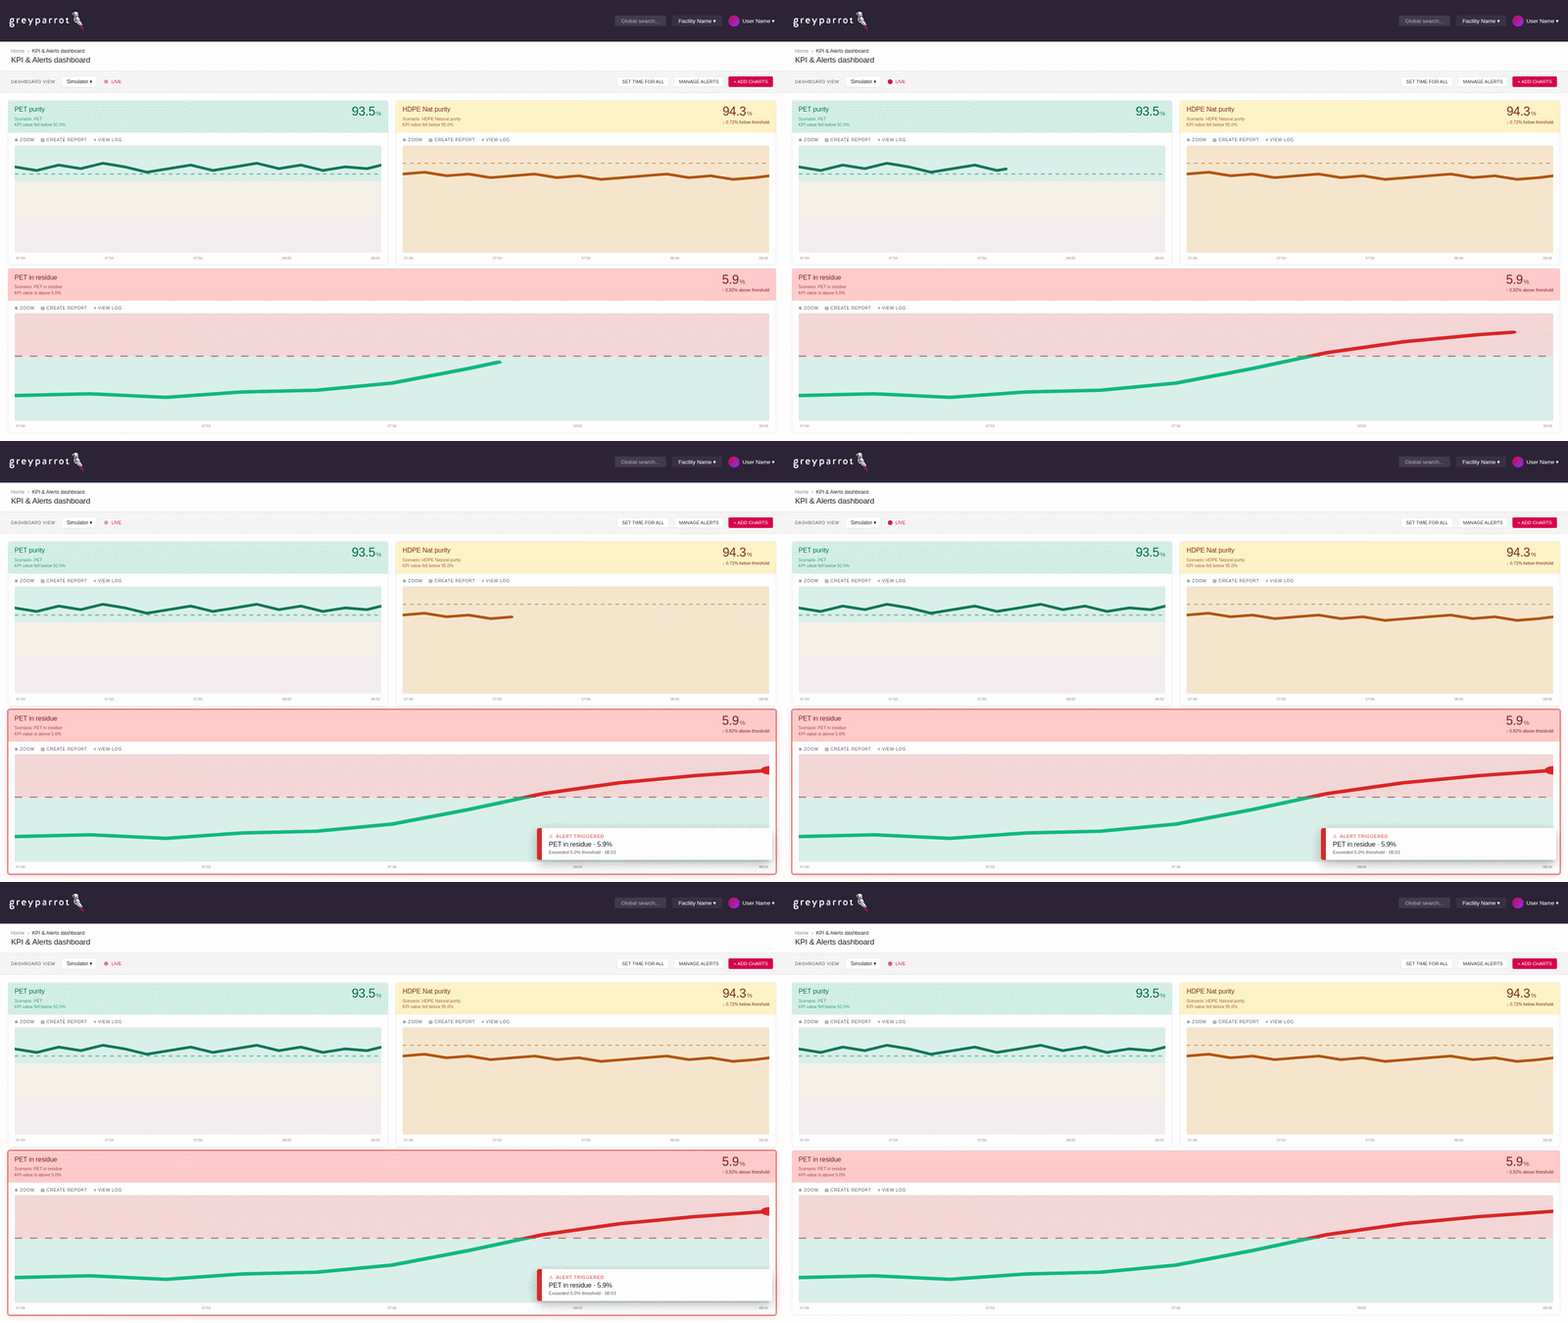
Live data on material composition lets your team act the moment something shifts, whether that's a quality issue or valuables ending up on the wrong line, and measure the impact of every change just as quickly.

new-spreadsheet

Investigate in detail

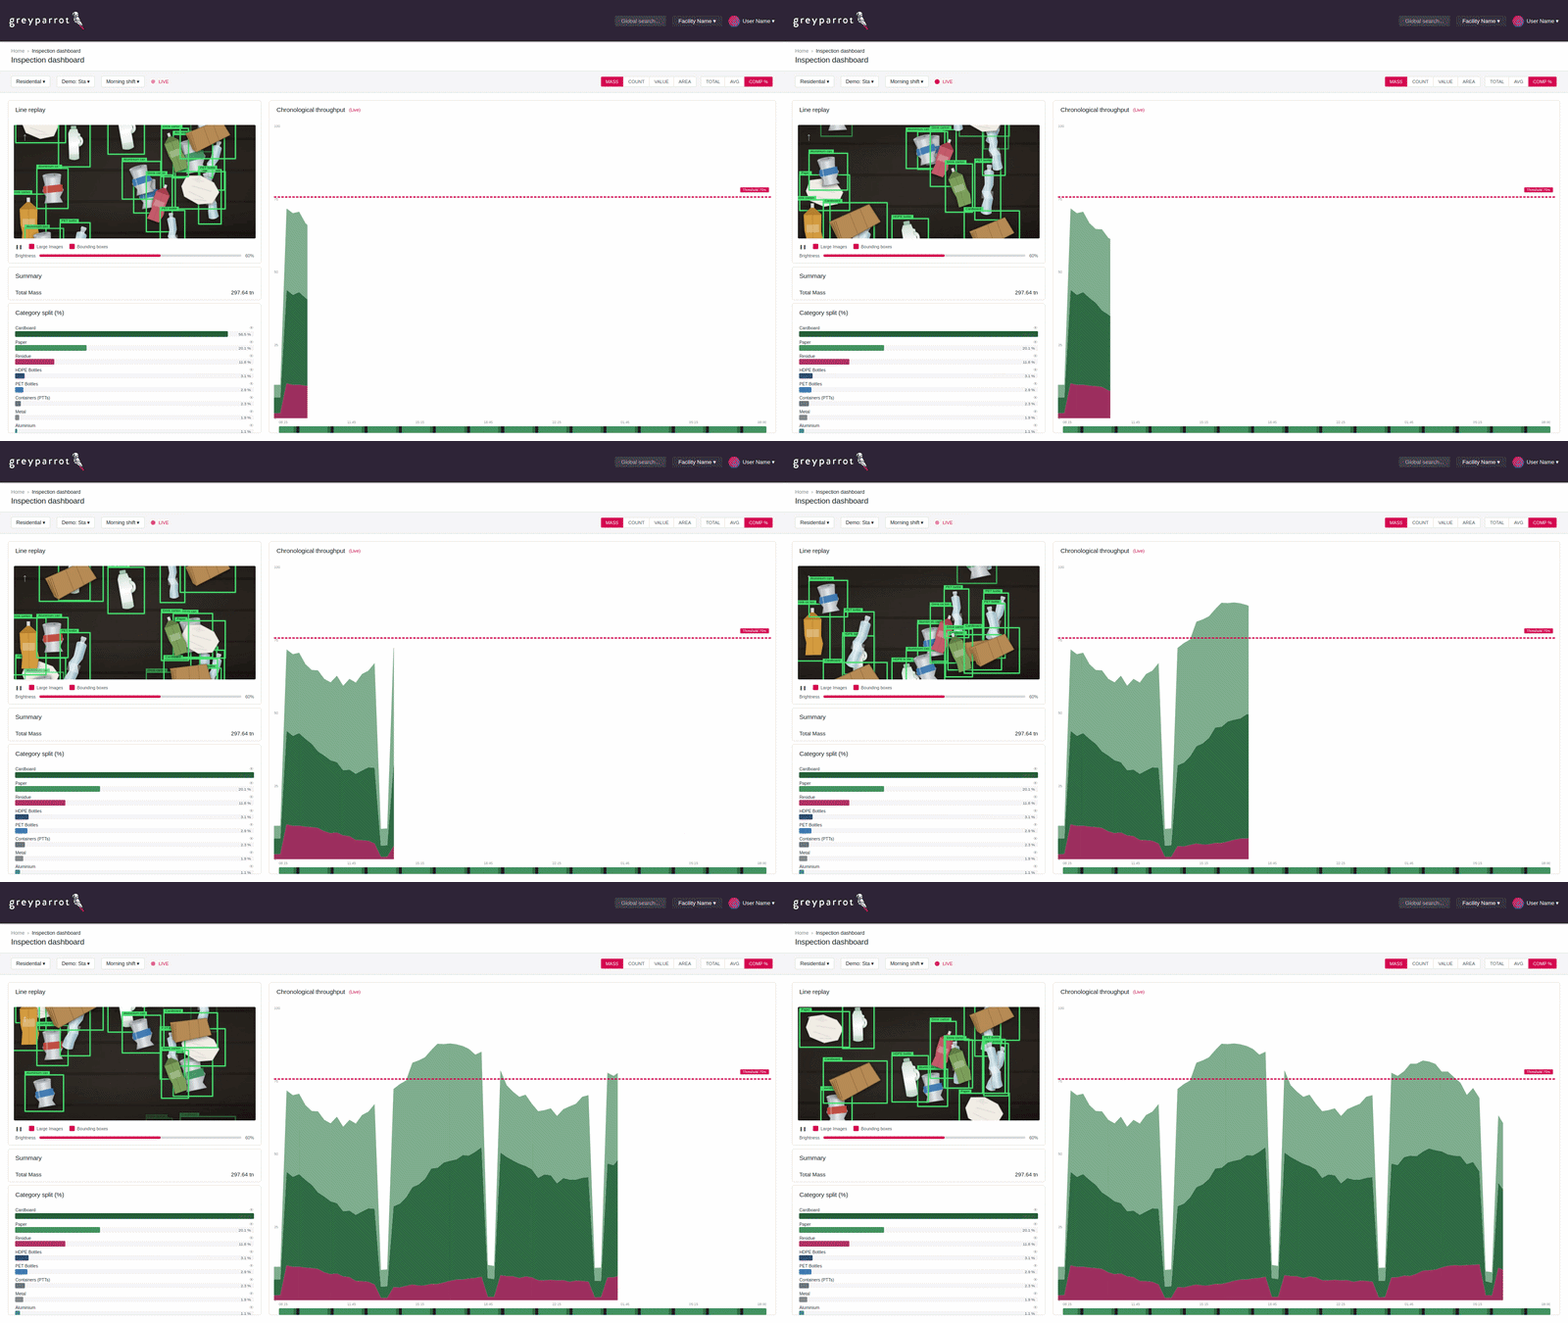
Review composition down to the minute, replay actual line images, and identify exactly where and when issues happened.

check

Report automatically

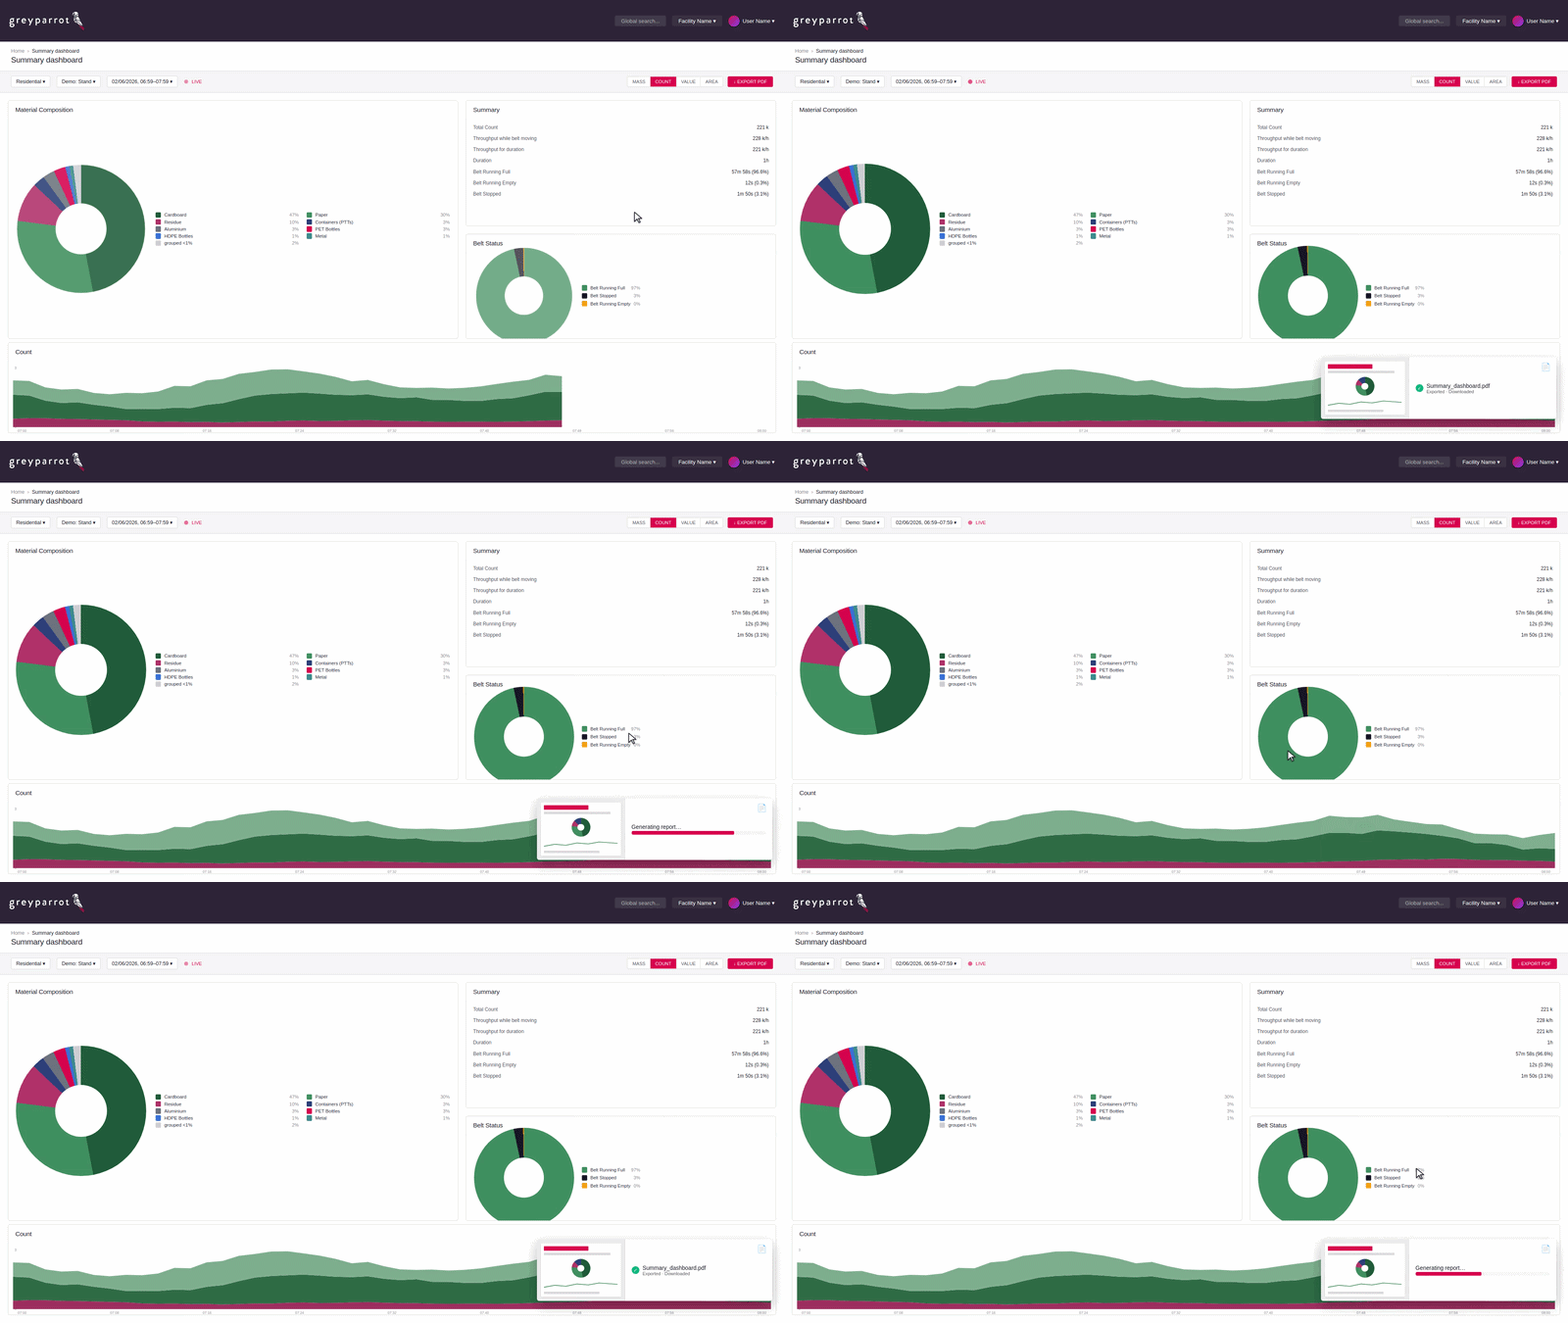
Generate compliance, shift and supplier reports on schedule, covering both the material you buy and the material you sell, exported in formats that drop straight into Excel, Power BI or Tableau.

THE PORTAL IN THREE LINES

A single platform for the teams that run your facility

Operations, engineering, and commercial teams each need to understand different aspects and groupings of the same waste data. The Analyzer portal serves all three, with consistent data, distinct tools, and no spreadsheet exports required.


01. OPERATIONS

React to live composition shifts

Control rooms and shift supervisors use real-time alerts and line replay to spot issues as they happen, and pause, adjust, or escalate within minutes rather than the next day.


12 min

to diagnose a purity drop that would have cost £47k, in one documented incident

02. ENGINEERING

Optimise equipment with evidence

Process engineers use the Inspection dashboard and Materials reports to baseline plant performance, identify underperforming machines, and prove the impact of every recalibration.


-17%

residue mass after a data-led optical sorter recalibration

03. COMMERCIAL

Run the plant on data, not samples

Commercial and management teams use Summary dashboards and scheduled PDF reports to brief leadership, assess supplier batches, and replace manual sampling for compliance.


100%

throughput coverage, vs <0.1% via manual sampling

PORTAL FEATURES

Four dashboards.
Every team in your facility.

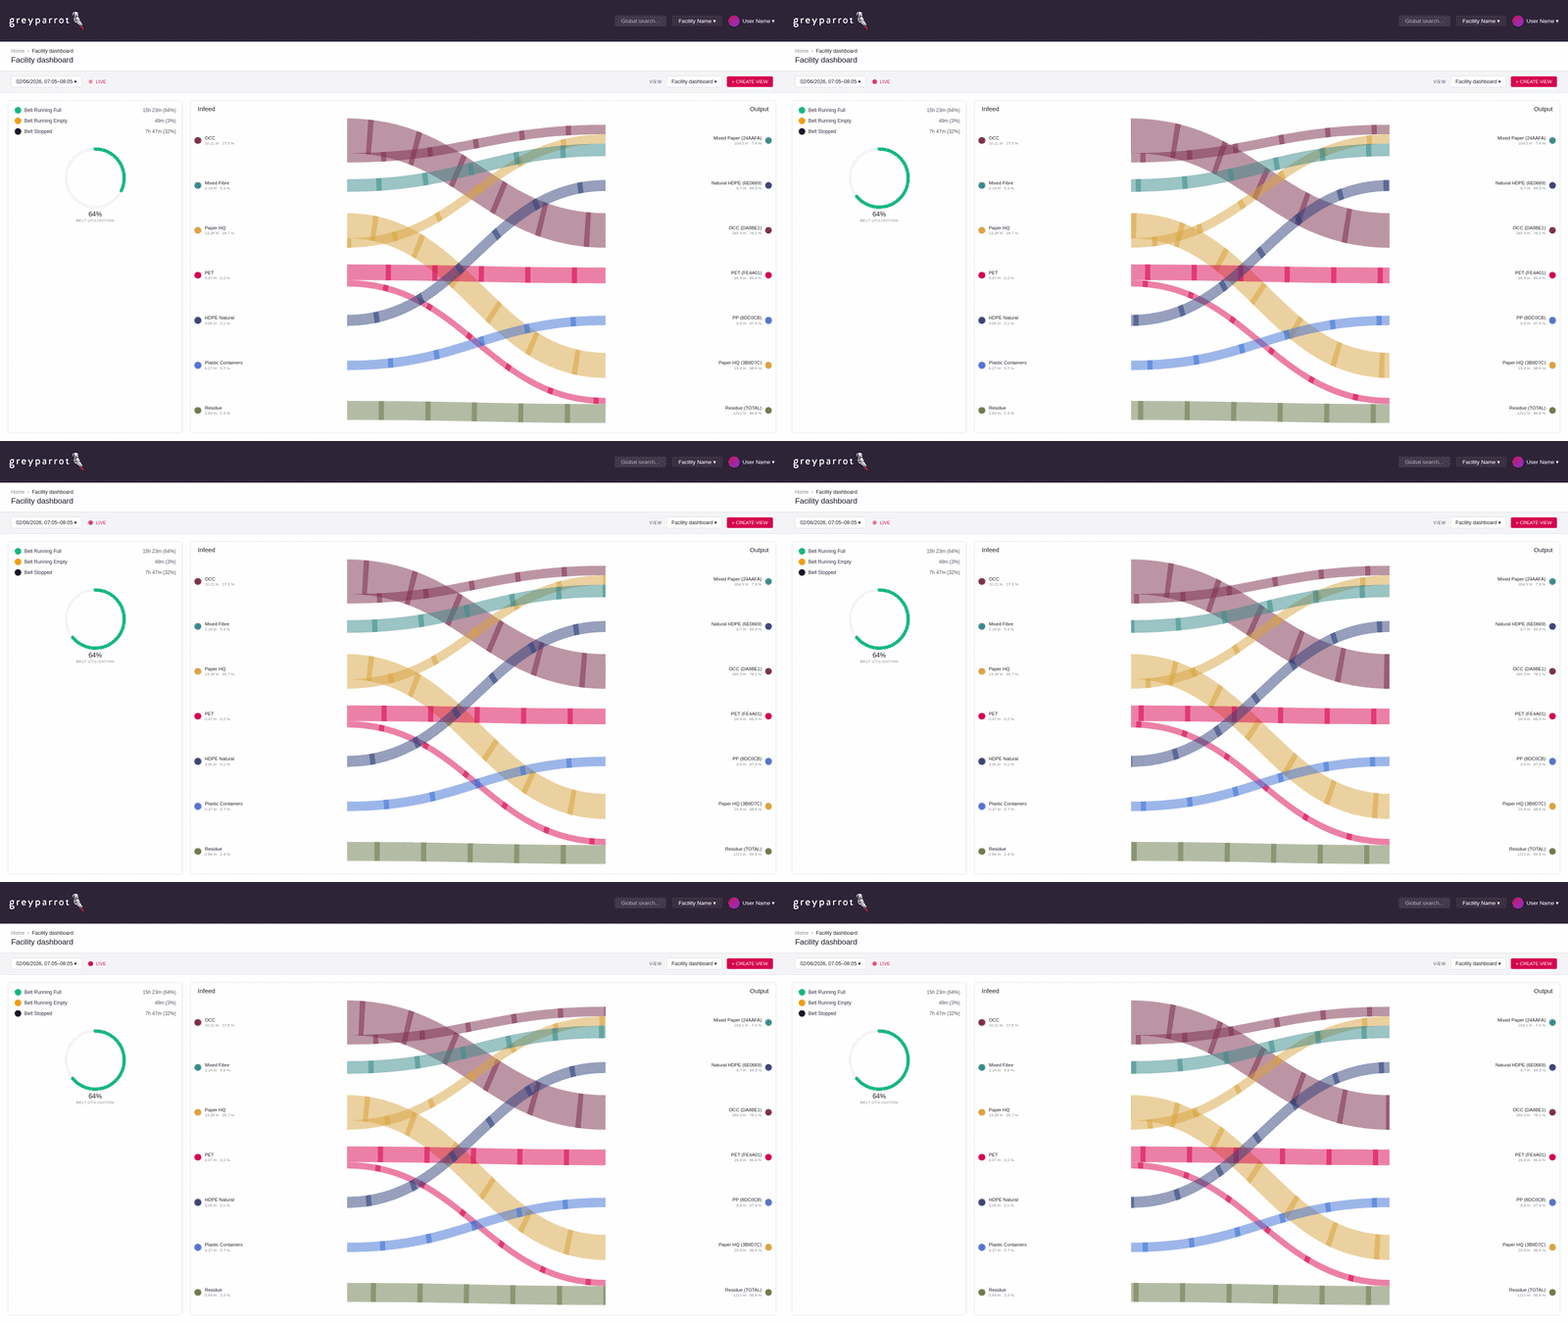
The Analyzer portal organises continuous waste data into four interlinked dashboards. Tap any item to see how it works. Only one is open at a time.

CUSTOMER SPOTLIGHT

How KSI built a data operating system for their entire facility

KSI Recycling, one of the Netherlands' largest recyclers, didn't deploy the portal in one go. Process Engineer Tjerk Wiersma layered each dashboard on top of the last, building toward a facility-wide view that operators rely on every shift.

  • Location | Netherlands

  • Throughput | 75,000+ tonnes of plastic packaging/year

  • Profile | One of the earliest adopters of waste intelligence

  • Speaker | Tjerk Wiersma, Process Engineer

IN THE WORDS OF OPERATORS

How facility teams
actually use the portal

Real outcomes from real recovery facilities. Each quote points to a specific way the Analyzer portal has changed day-to-day operations.

Green Tech
Green Tech

+10% PET recovery revenue


"Instead of guessing, we know the exact percentage of contamination. That means we can decide faster, adjust the blend, and increase profitability."

Tadas Greentech

Tadas Lenkutis, PhD

Technologist/Production Manager, Greentech Baltic

KSI
ksi-black

30% -> 20% value lost to residue

"Before, we were losing around 30% of our valuable commodities. Now we're losing just 20%, and our residue composition is back within regulatory thresholds."

Tjerk KSI

Tjerk Wiersma

Process Engineer, KSI Recycling

Re-Gen
re-gen

200k+ t/yr monitored with real-time alerts

"By arming our plant managers with that information, they can now set thresholds or alerts, or study the dashboard and say there's maybe too much hard plastic arriving on this line."

Conor-McCooey (1)

Conor McCooey

CIO, Re-Gen

INSTALLATION

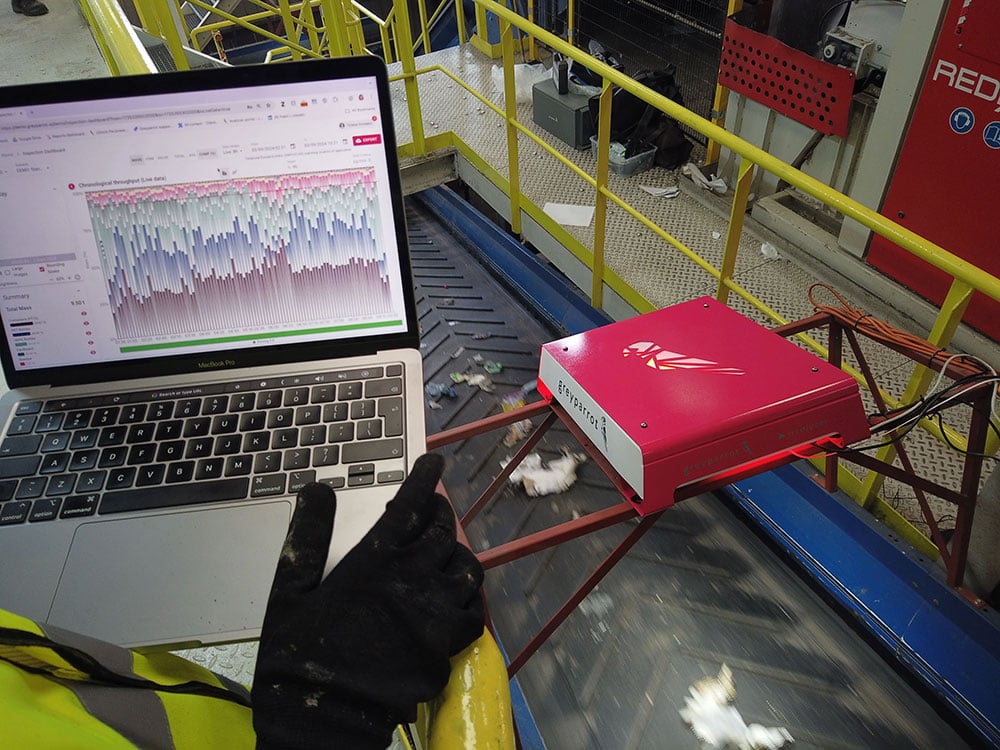
Mounts above your existing belts

Analyzer units install above existing conveyor belts, no infrastructure changes, no downtime to your sorting equipment. Detailed mounting guidance is provided before hardware arrives at your facility.

MOUNTING

Simple metal frame

Mounts above the conveyor. We provide design and consultation before delivery.

POWER

110-230 V supply

Single-phase. Standard facility power, no special wiring.

NETWORK

Wired ethernet, 1 Mbps

Up/down. Wired connection only, no facility Wi-Fi requirement.

BELT WIDTH

Up to 1600 mm with a single Analyzer

Wide-belt installations cover accelerator belts.

DATA & SECURITY

Enterprise-grade by default

All Analyzer portal data is held to internationally-recognised security standards. Our support team works alongside customers' security teams to keep pace with evolving best practice.

ISO

ISO 27001

Cyber-Essentials-Logo-v2

Cyber Essentials (UK)

Untitled design-Jul-02-2026-02-49-30-4559-PM

Granular permissions

SEE IT IN ACTION

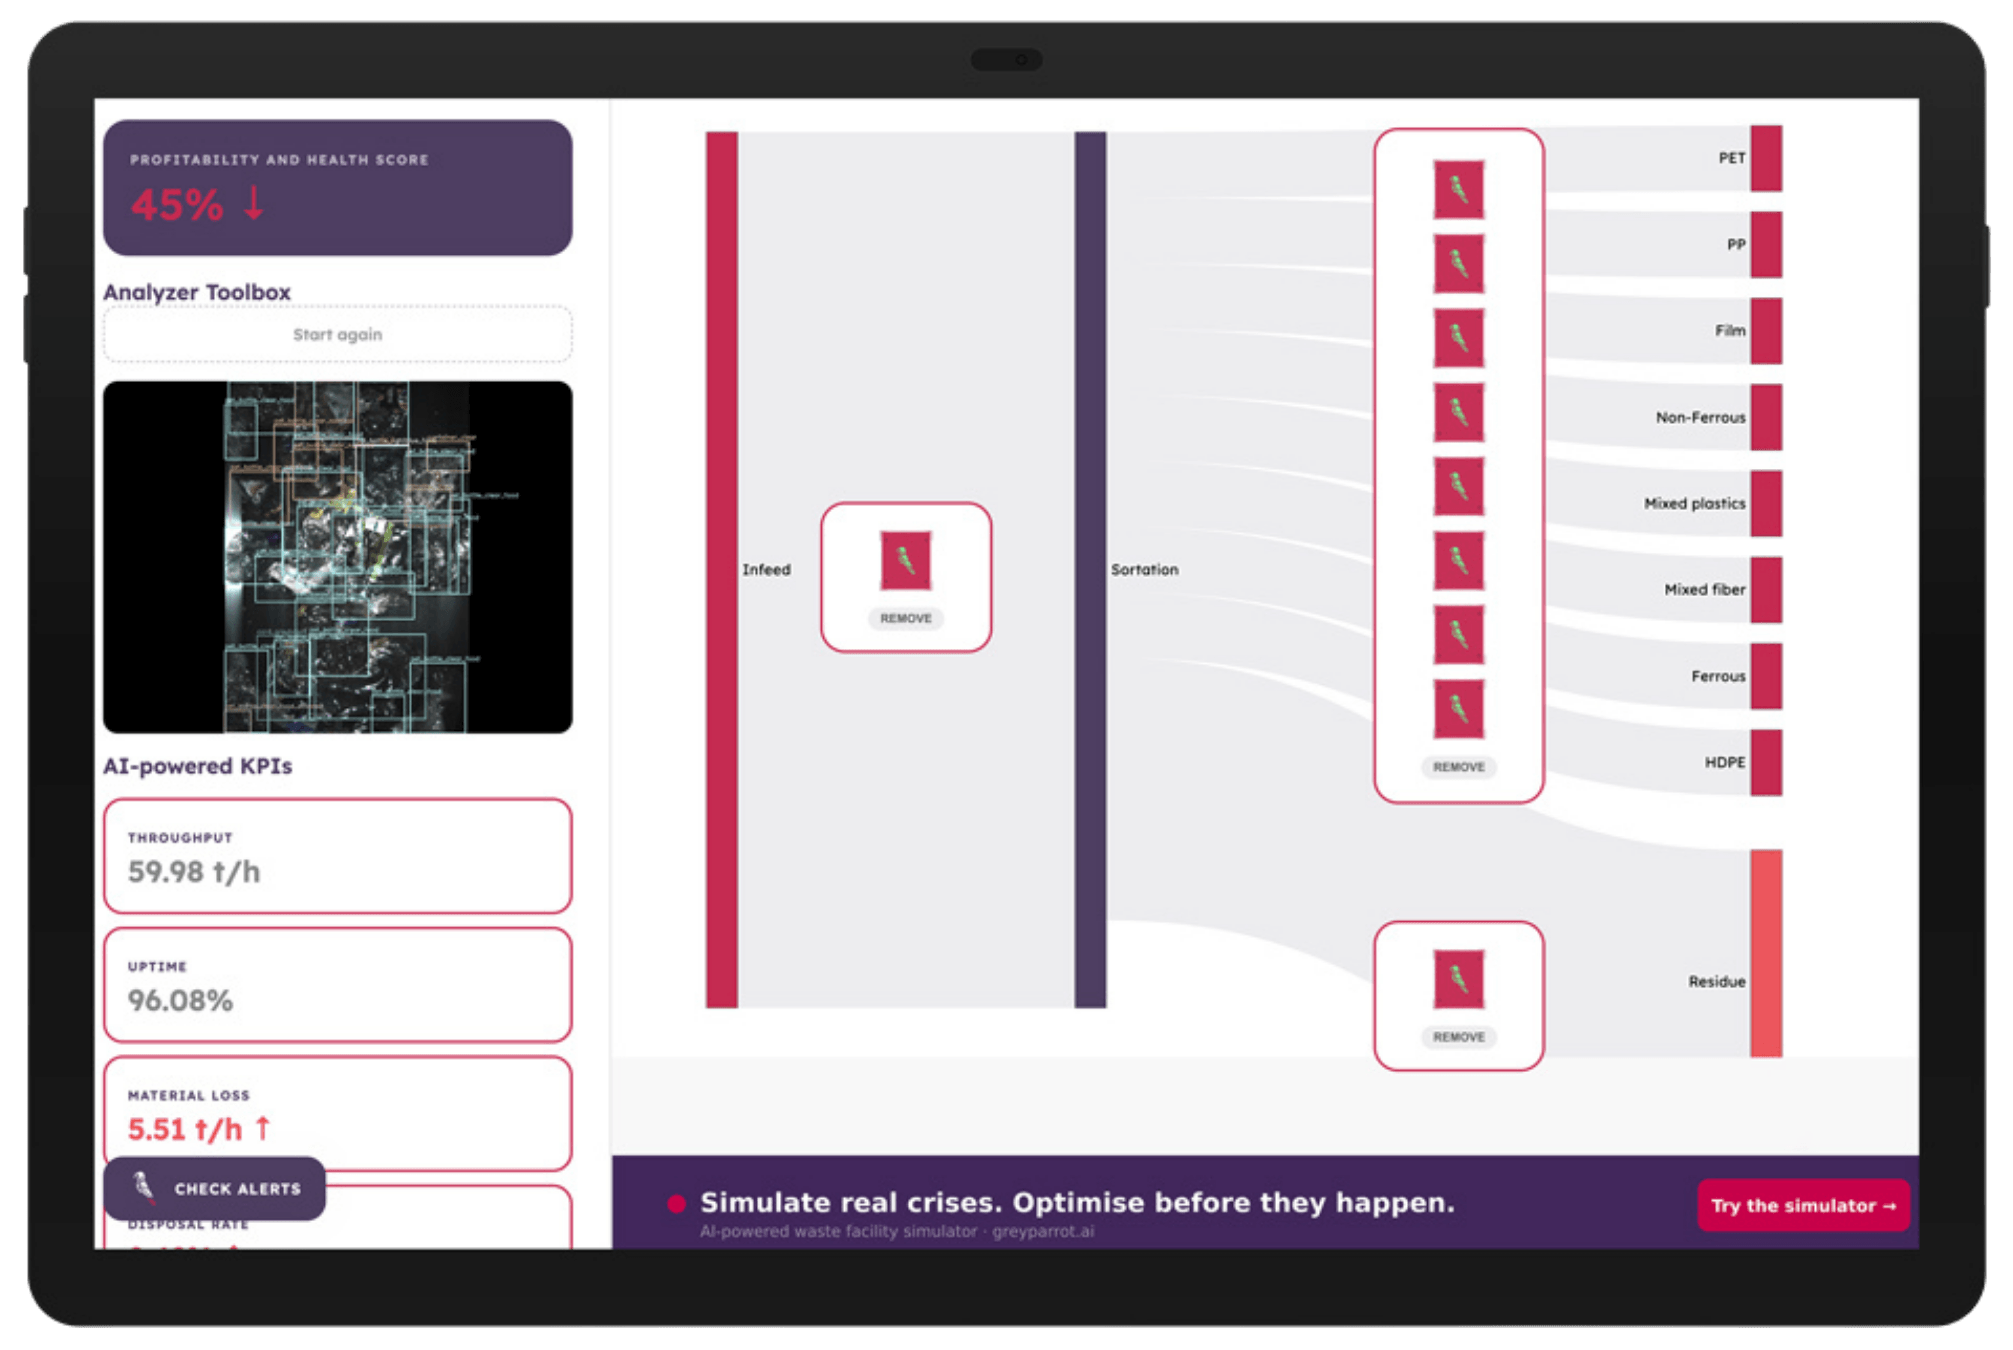
Run the AI facility simulator, 8 minutes, no sign-up

Three real-world MRF scenarios, a PET line issue, a supplier-change contamination event, and a throughput-vs-purity decision, and how the Analyzer portal changes the outcome.

facility simulator

FREQUENTLY ASKED QUESTIONS

Questions we hear before deployment

Practical questions about how the Analyzer portal works, what it integrates with, and what happens after you sign on.

Ready to put waste data to work?

Book a 30-minute portal demo, or explore the AI facility simulator first to see how the dashboards behave in practice.