
-1.jpg?width=780&height=532&name=GreyParrot-facility-monitoring-IFAT-newsroom%20(1)-1.jpg)
We launched our new Facility Dashboard at IFAT Munich 2024 to give materials recovery facilities (MRFs) more control over their most vital processes.
Read on to learn how a bird’s-eye-view of a facility’s operations translates into higher-quality output, less material lost to residue, and a more profitable recovery operation.
Introducing the Greyparrot Facility Dashboard
The Facility Dashboard distils an entire sorting facility’s performance onto a single live page.
It’s designed to surface the information operators need as they adapt to changing infeed material and shifting market conditions — making the most of every bale that leaves their facilities.
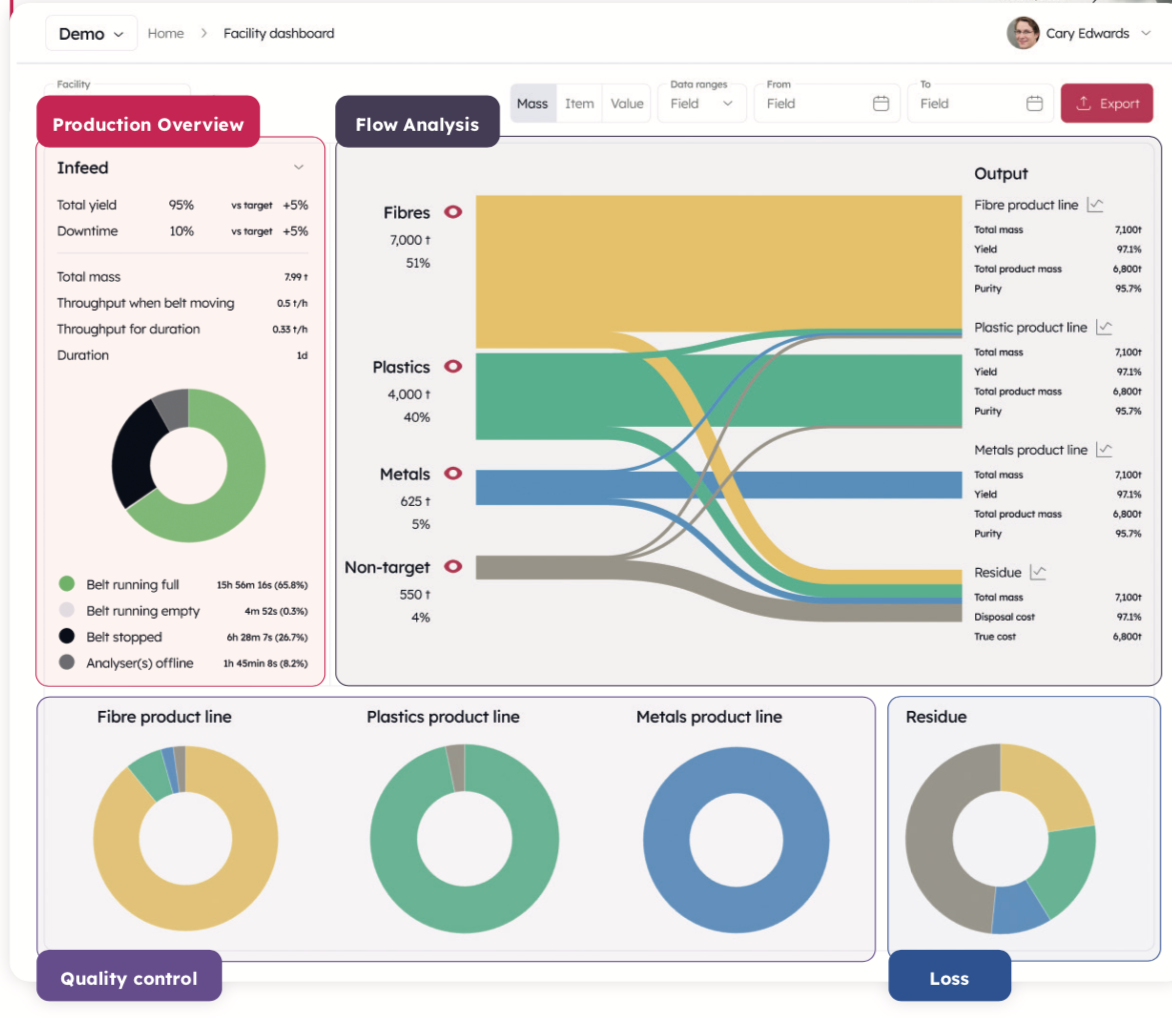
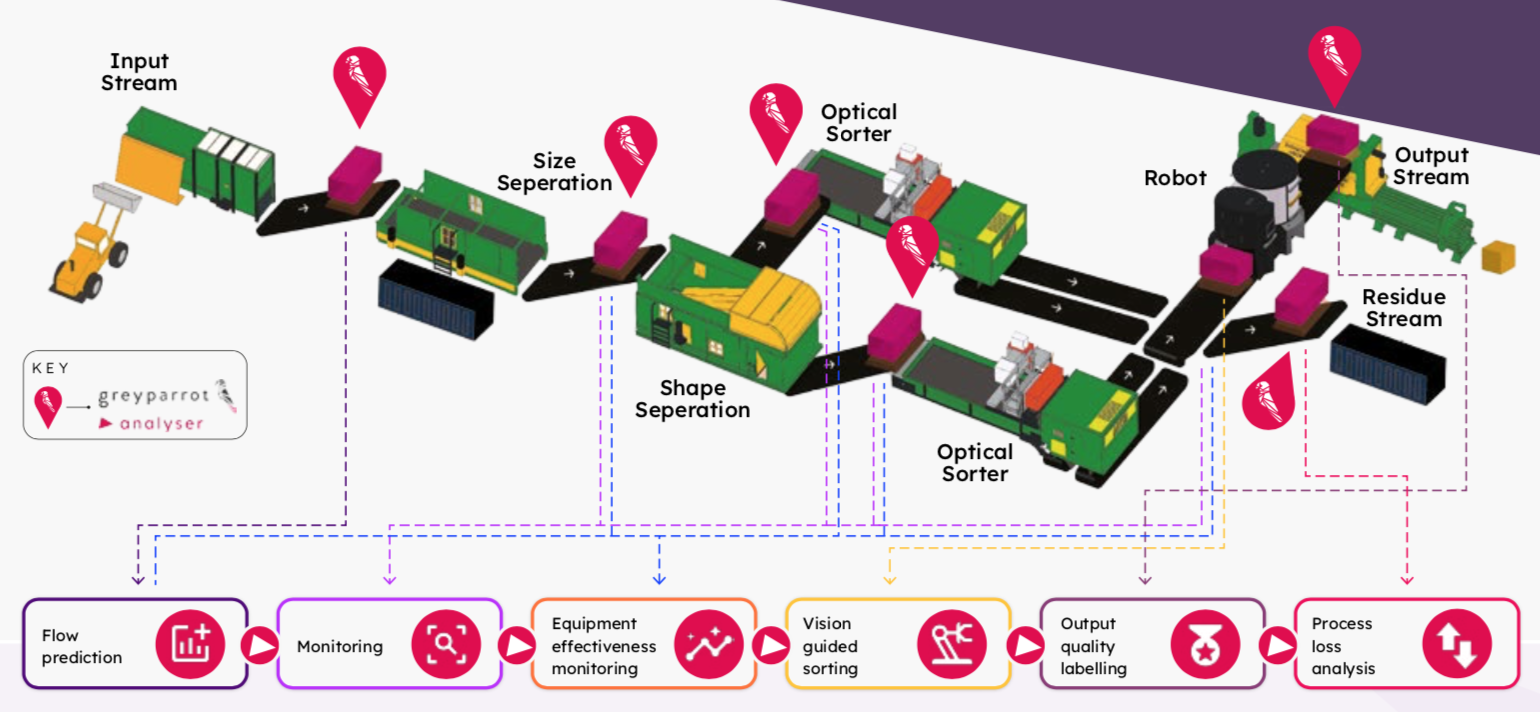
Displaying real-time data gathered by Analyzers deployed on key belts, it’s a connected view of the most critical processes and material in a recovery facility that allows operators to take proactive control of sorting efficiency:
- The production overview section offers a live look at a facility’s vital signs, from total yield to throughput, belt status and downtime.
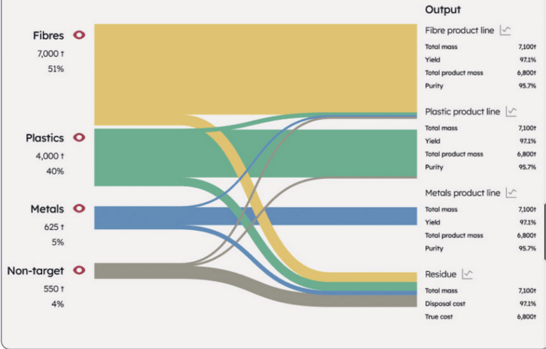
- The flow analysis graph is a real-time Sankey diagram breaking down the mass balance of material flows. It tracks materials by weight from infeed to outfeed to reveal where they end up — and the purity of the final output.
- The quality control section is a simplified view of material purity for each product line being monitored with an Analyzer unit.
- The loss graph shows the proportion of recoverable material being lost to residue (landfill or incineration).
Balancing throughput and purity
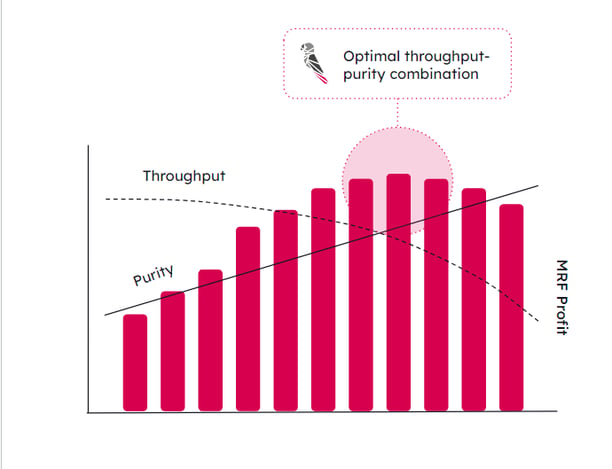
For many of our customers in waste sorting facilities, the balance between throughput rate and product quality has the biggest impact on profitability. We designed the Facility Dashboard to help them adjust throughput as the composition of infeed material changes in real-time.
With Analyzer units deployed on an infeed line and key product lines, they can use the Facility Dashboard to track material yield against throughput rate. Custom thresholds for material purity are set using Analyzer’s Alerts feature, and are shown as targets in the Facility Dashboard.
The Facility Dashboard provides that information at-a-glance, allowing facility operators to take immediate action:
- When flow analysis and quality control graphs show a dip in sorting performance, operators can take fast action to reduce throughput rates, address specific sorting processes and belts, and allocate manual sorters where they’re needed most.
- If infeed material is heavily-contaminated, facility staff can reduce throughput until the Facility Dashboard shows yield and product purity meeting quality objectives.
- Historical data on infeed material and resulting yields enables staff to optimise infeed blends for the future.
Recovering more value from residue lines
By deploying Analyzer unit on the residue line, facility managers can use the same dashboard to track another key metric for profitability: the amount of valuable material lost to landfill and incineration.
The Loss and Flow Analysis modules display the composition and mass of residue line material, making it possible to reduce throughput rates as soon as the valuable material sent to residue exceeds acceptable thresholds.
Automating quality control
The Facility Dashboard empowers MRFs to reduce human contact with waste, with continuous AI monitoring replacing manual quality control checks.
Automated monitoring also allows operators to respond to fluctuating supply and demand in the wider recyclate market:
- When market forces lead to drops in purity requirements, sorting facilities can use Greyparrot’s Alerts feature to reduce their purity thresholds. That allows them to increase throughput rates — all while monitoring the impact of those changes on mass balances and final output purity.
- For applications with higher purity requirements (like those that produce food-grade material, for example) staff can find the optimum balance between a profitable throughput rate and high yield by adjusting operations and tracking them from a single dashboard.
The next generation of MRF operations, on a single screen
With the Facility Dashboard, we’re empowering MRF operators to manage their processes and output in the most intuitive, proactive way possible.
It’s a first look at the active facility management characterising the next generation of MRFs. New plants are being designed that use AI to monitor each essential belt as standard — with the Facility Dashboard gathering every sorting process, material flow and belt into a single hub of live insight.
If you missed the live demo of the Facility Dashboard at IFAT Munich 2024, you can get in touch below to learn more!

.png?width=501&height=285&name=Events%20social%20card%20(5).png)

-1.png?width=501&height=285&name=webinar%20(1)-1.png)