
What’s new
- Custom metrics and KPIs — Create tailored metrics using any of the datapoints our units collect, then combine them with performance thresholds to create your own custom KPIs.
- Updated dashboards — Display those custom metrics, KPIs and Alerts on fully-customisable dashboard views tailored to individual roles or entire teams.
- Time labels — Organise data based on your facility’s schedule, whether you want to measure specific shifts, supplier deliveries or bale composition.
A note from the Greyparrot product team
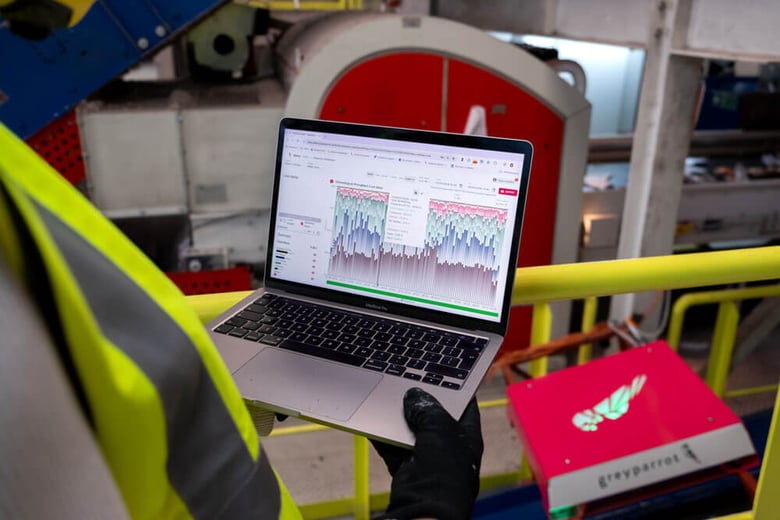
No one knows a recovery facility better than the people that operate it on a daily basis, and no two facilities are exactly the same.
After working closely with our customers around the world, we’ve learned that each plant has its own schedules, its own challenges — and its own ways of measuring success. Their Analyzer portal should reflect that fact.
That’s why we’ve spent the last few months putting the building blocks of analysis in your hands. You can now create custom metrics, dashboards and reports that mirror your facility’s operations, making Analyzer insights more actionable and applicable than ever.
Track the metrics that matter to you
Measuring sorting efficiency, yield and purity doesn’t look the same in every facility, so we’ve made Analyzer flexible enough to adapt to our customers.
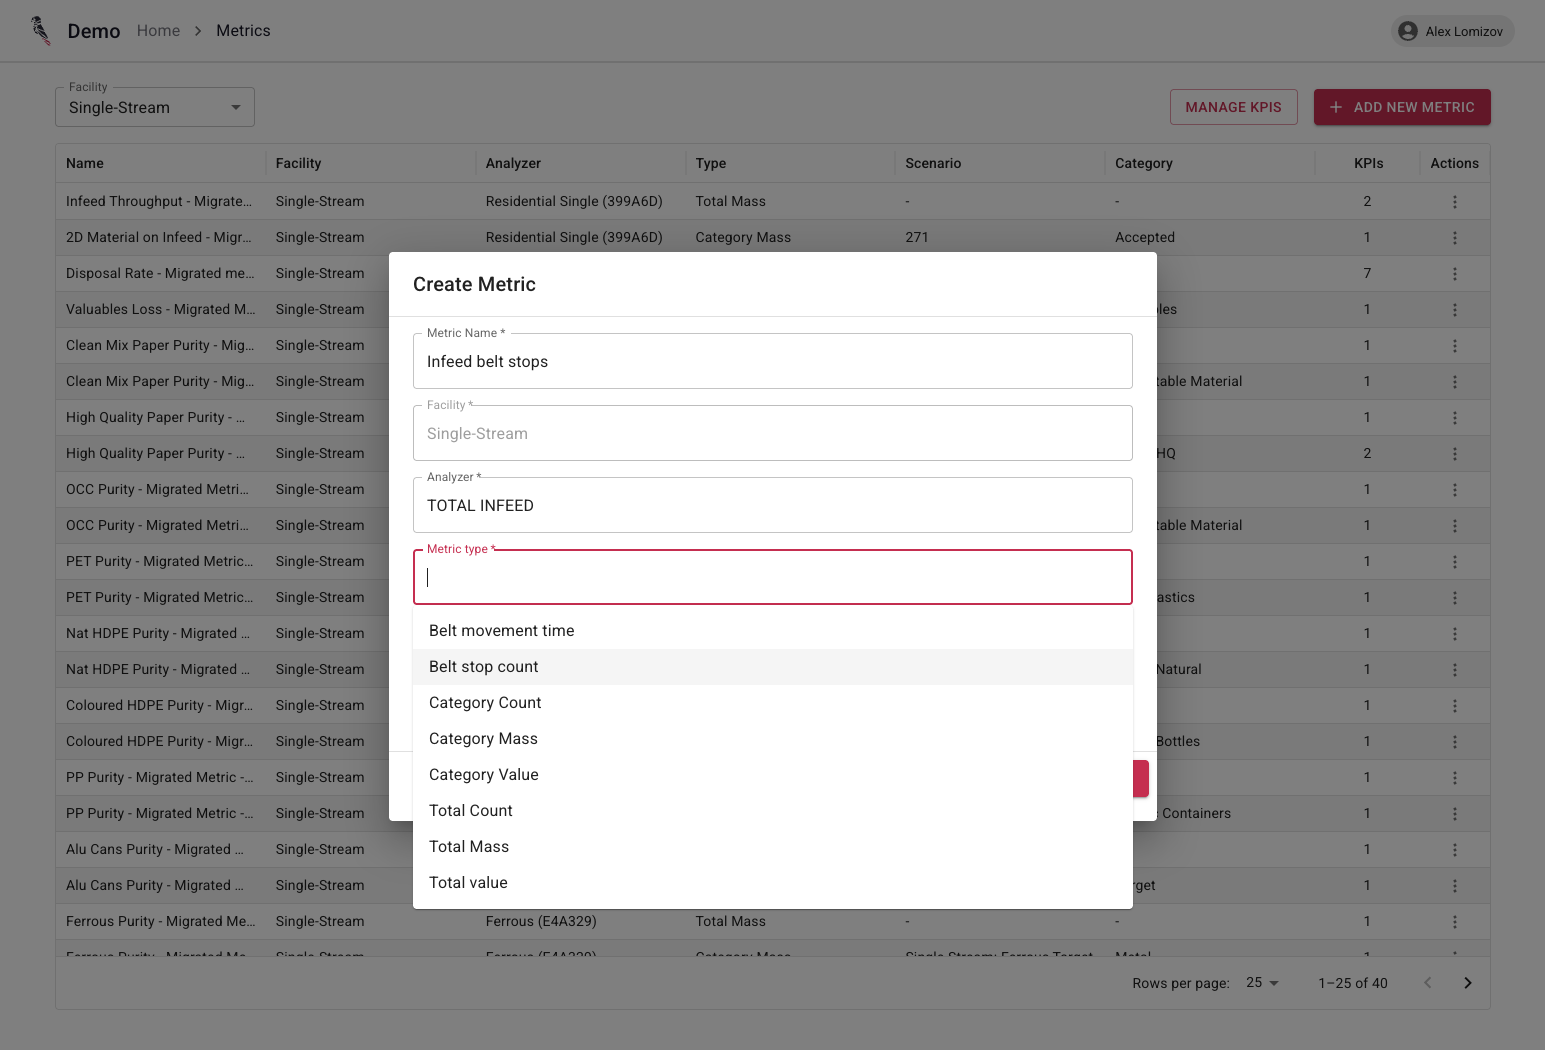
You can now build your own metrics and KPIs, then use them throughout the Analyzer portal in dashboards, reports and Alerts. It’s a powerful new way to tailor analysis to your specific needs.
💡 Metrics are data points from Analyzer units. Use them as analysis building blocks, tracking materials, throughput, purity and more across multiple Analyzer units.
💡 KPIs enable you to create calculations using those metrics based on your performance criteria. Use them to create formulae that set thresholds, track averages, and create custom Alerts.
Whether you need to measure infeed quality, track specific materials or keep an eye on throughput, you can do it with custom metrics.
Organise Analyzer data around your facility’s schedule
After the fantastic response to our Shifts feature earlier this year, we wanted to give users even more control over the way they track data throughout their facility’s day.
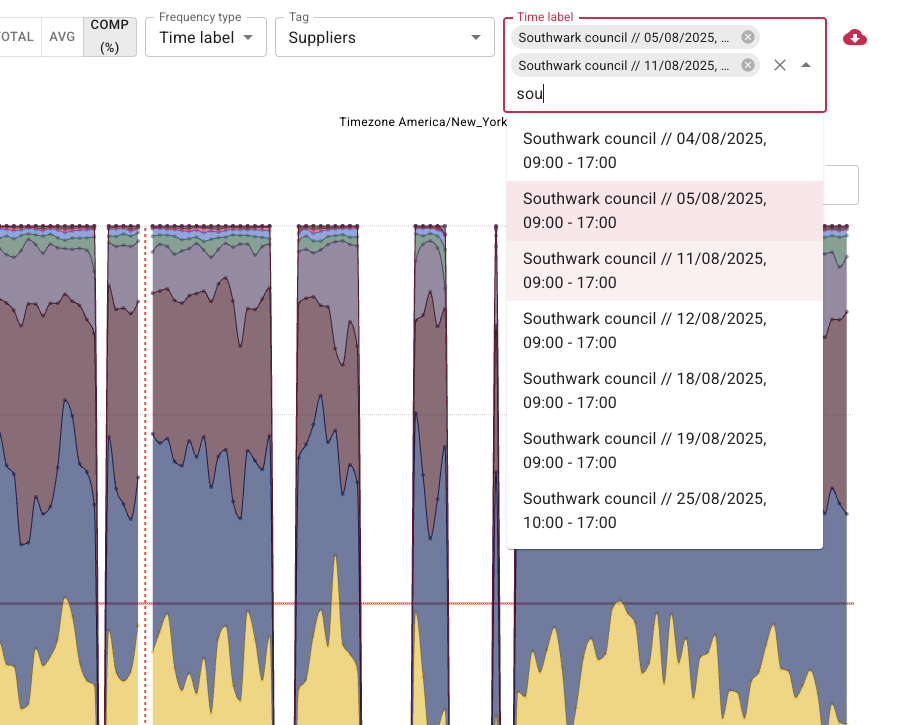
Our customers organise their days around everything from the delivery of supplier material to baling, shifts, and maintenance downtime. Time Labels make it possible to separate material data based on those critical time periods:
- Compare suppliers by analysing materials based on specific delivery times.
- Exclude downtime and maintenance from reports to assess actual sorting performance.
- Isolate trial batches, generate bale-level reports, and more.
Combine your Time Labels to track things like bale quality, supplier material and picker team efficiency at the same time, reporting on the combinations.
Like custom KPIs, you can use Time Labels throughout the Analyzer portal. Apply them to any dashboard and any report to view data on your schedule.
Surface the data you need, when (and where) you need it
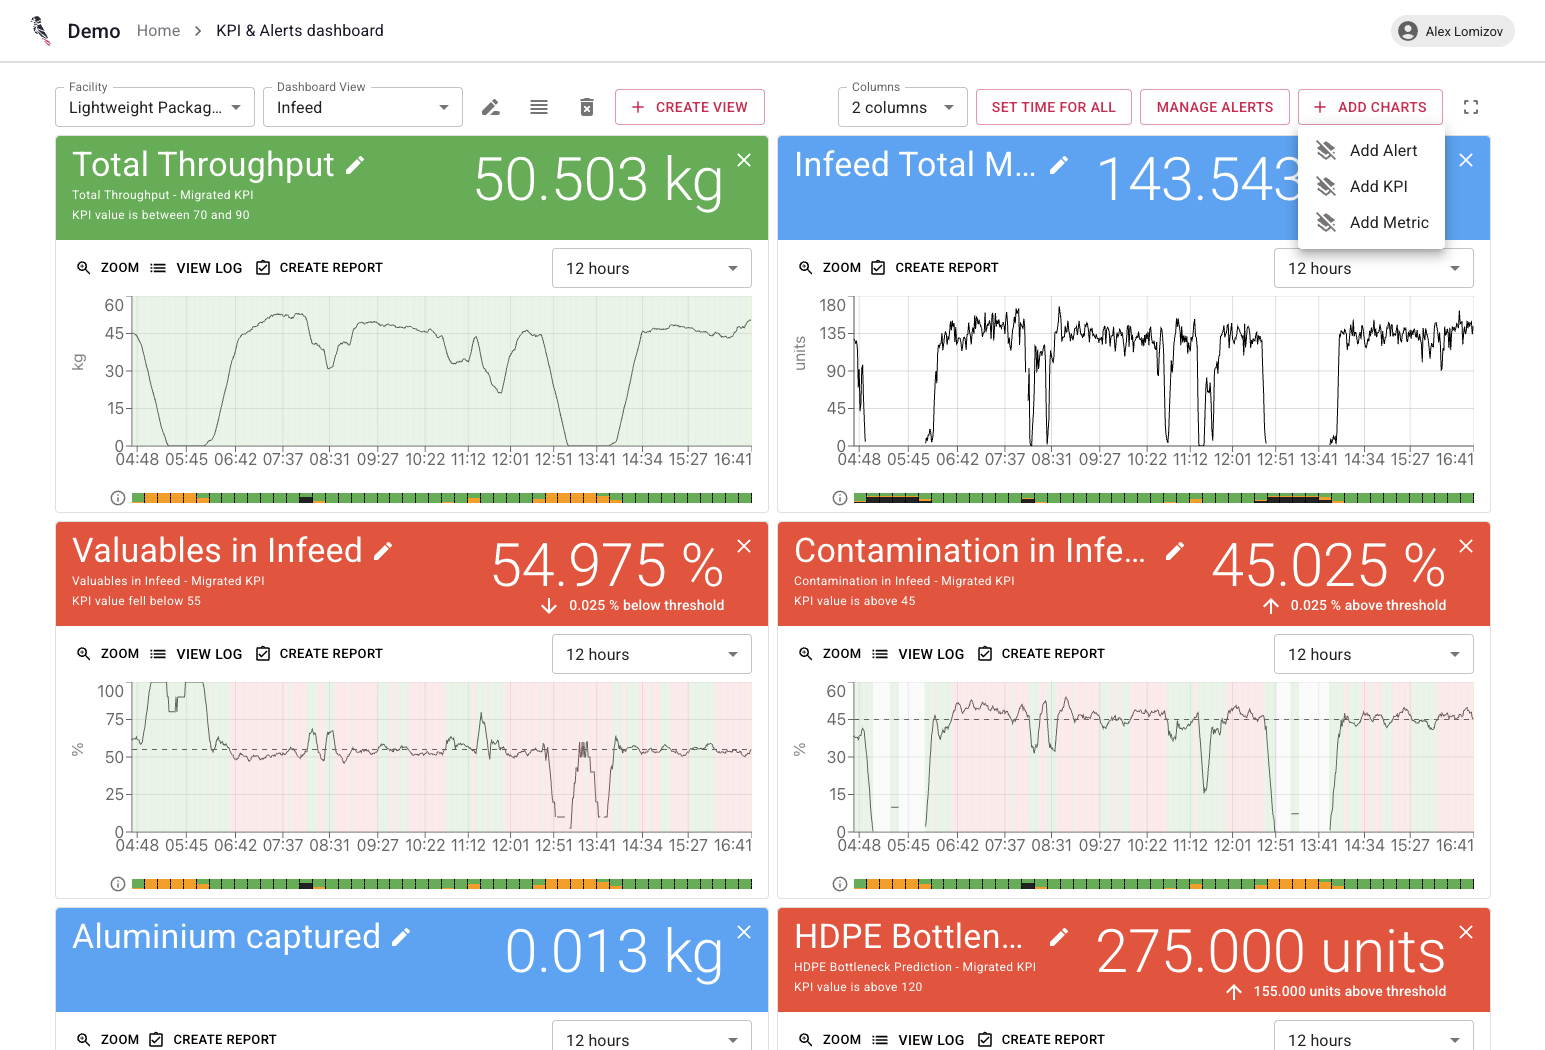
We wanted to make it simple to access (and act on) your custom KPIs, metrics and alerts. With than in mind, you can now created dedicated dashboards that gather them in one place:
- Use custom KPIs and metrics to track live facility performance, not just alerts.
- Tailor dashboards to specific roles or teams, because Analyzer data isn’t just for operators. It’s an efficiency-booster for engineering, quality control and commercial teams too, and each group needs to surface different insights.
- Create unlimited dashboard views, whether they’re for shift leaders that need to keep track of belt stops and throughput rates, facility managers keeping an eye on purity and yield, or commercial teams tracking final bale quality.
Reports are just as flexible as our new dashboards. Combine any number of KPIs and metrics on any time frame, then generate them automatically as soon as a supplier batch arrives, shift ends, or bale leaves your product line.
What we’re working on next
Each time we introduce a new feature, Analyzer data becomes a more detailed reflection of your facility’s performance and material.
There’s even more to come over the next few months. Expect Analyzer portal upgrades, an update about automated sampling support, and further developments from AnalyzerWave, our combination of AI and near-infrared (NIR) recognition.
We’d love to hear what you think of the new features, and what you’d like to see us add next. Get in touch to share your input, and help us shape the future of waste intelligence technology.
Start using the new features
If you’re already an Analyzer user, you can start using custom metrics, KPIs and Time Labels right away. As always, reach out to your technical account manager if your Knowledge Hub doesn’t have the answers you need.
If you want to learn more about the Analyzer system, book a live demo to see it in action.
.png?width=501&height=285&name=3.%202026-team-fun-photo%20(1).png)

