
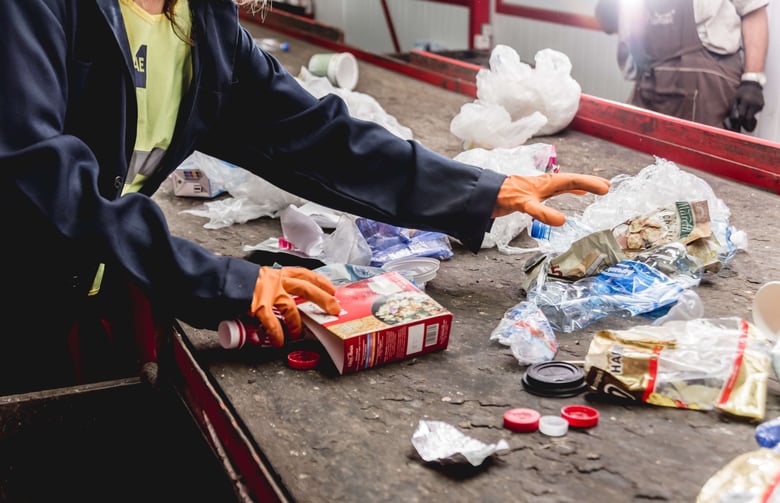
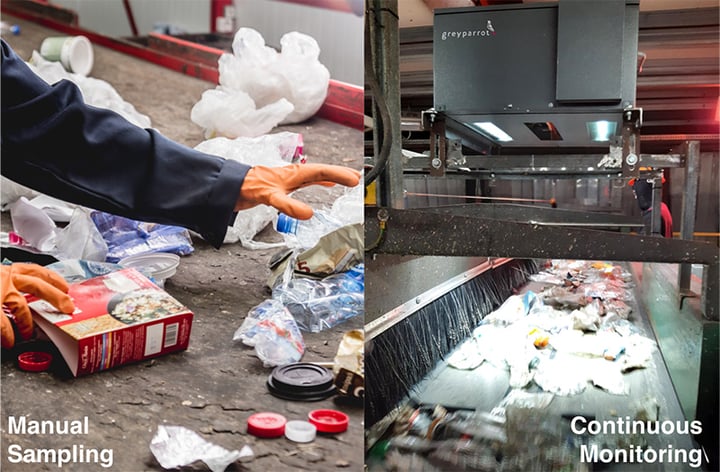
Computer vision is an area in artificial intelligence (AI) that uses camera systems to capture and analyse images and videos to identify and categorise objects. When applied to MRFs (Material Recovery Facilities) recent advancements in this technology allows machines to ‘see’ and classify waste at human-level recognition or better. Currently, waste is manually sampled. Manual sampling is limited by time and resource constraints and as a result covers a very small proportion of all processed waste. Continuous monitoring of waste through computer vision ensures a much better depiction of true waste composition, allowing waste carriers to unlock the true value of their waste.
I used to lead the sampling at a Suez MRF and so have a particular interest in overcoming the limitations of manual sampling. No matter how rigorous I was with high frequency and stratified sampling to attain as representative a sample as possible, it was very difficult to have absolute certainty and faith in the results. Composition of waste is dynamic and fluctuates throughout the day. Similarly, the purity of waste streams vary over time. Our data team evaluated data from a partner MRF to visualise how the purity of their PET stream varies.
Measuring the purity of a PET stream
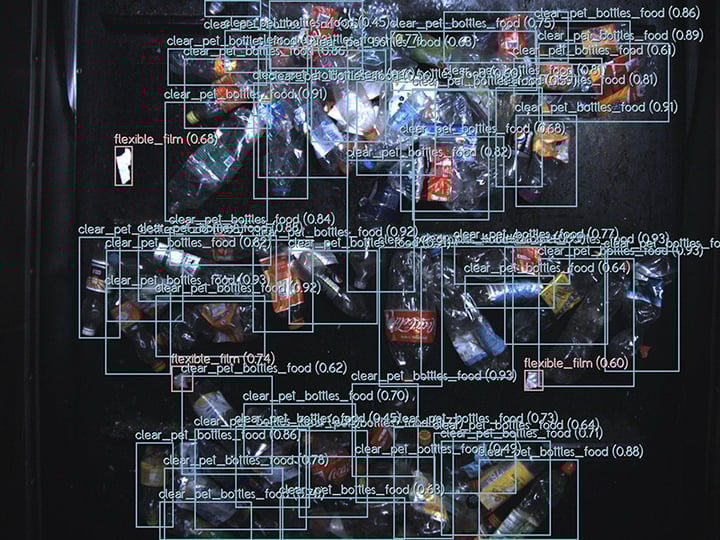
Greyparrot’s AI Waste Monitoring Unit is currently being used to assess the % target material (all clear and light blue PET bottles and trays) on a PET output stream. For the purposes of this analysis, we evaluated the data over 24-hours: All minutes with zero and low tonnage were removed to eliminate purity outliers resulting in 1117 data points for analysis. The pink line in graph 1 presents the % target material per minute. Each light grey marker indicates the purity of bales produced (every 13 non-zero minutes). The dark purple line represents the day’s purity average: 92.47%.
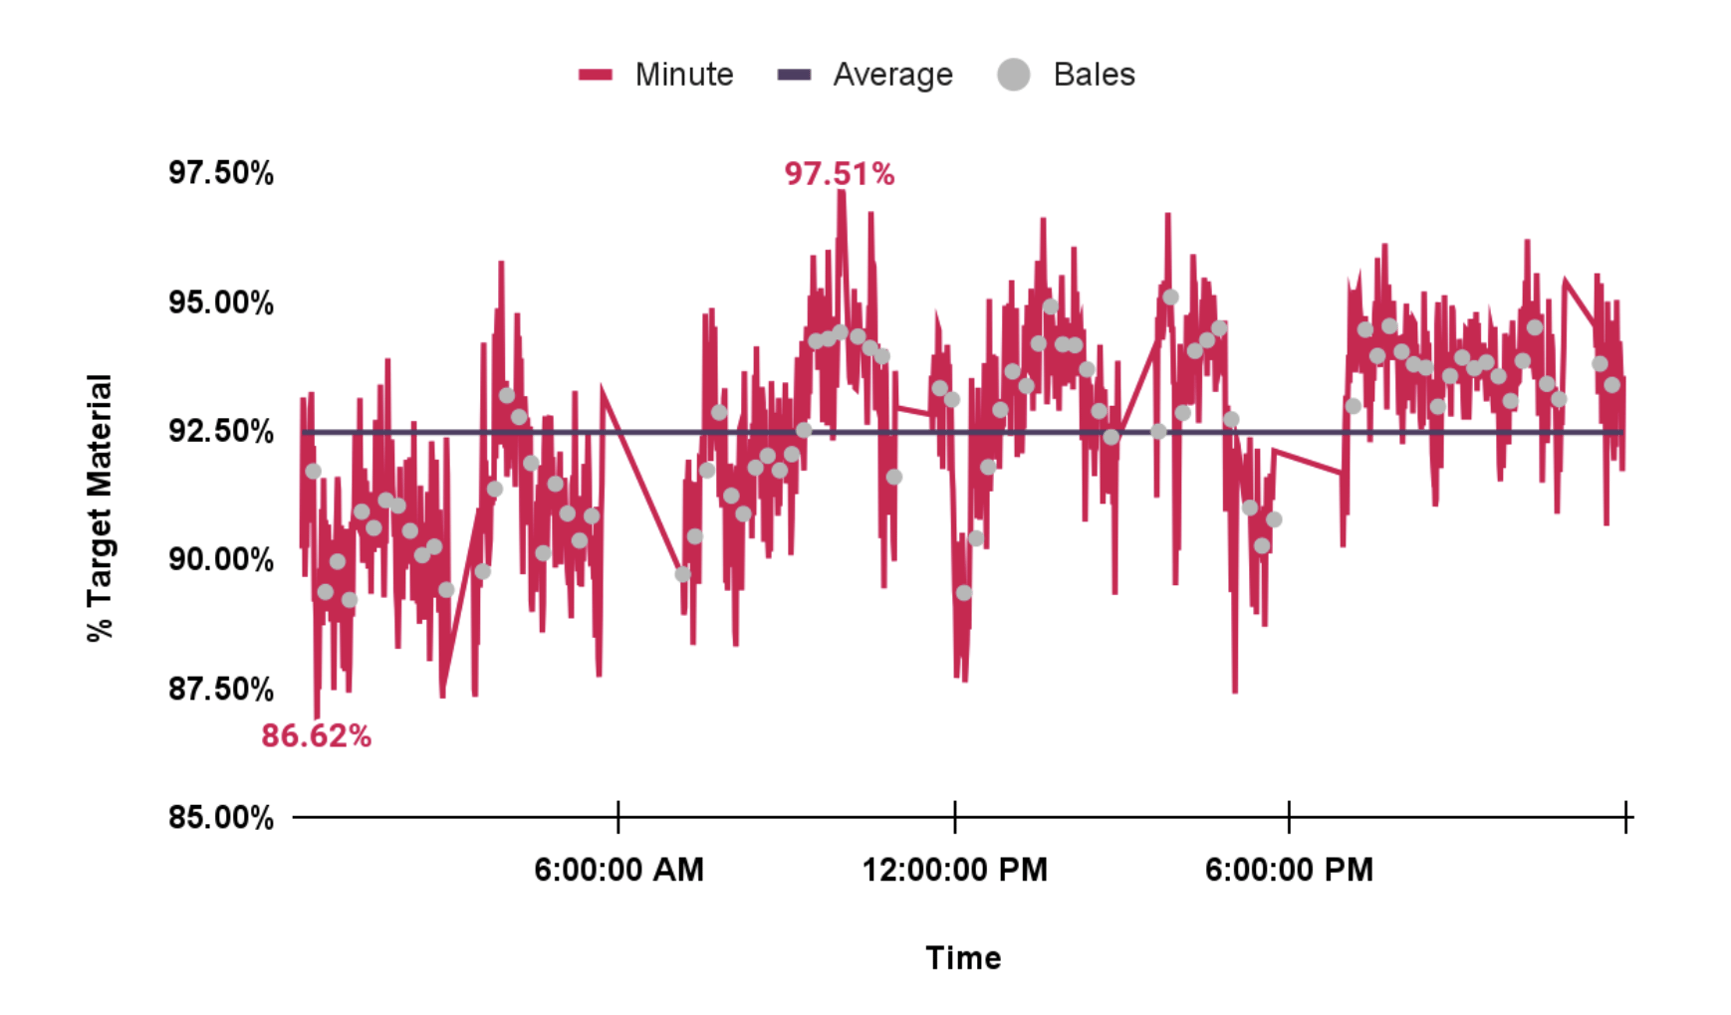 Graph 1. A graphical representation of the purity (% target material) of a PET stream - per minute and per bale - on an output PET stream over 24-hours.
Over the 24-hour period, a single minute (roughly similar to one spot sample) ranged from 86.62% to 97.51% - a fluctuation in purity by 10.89%. This indicates that spot sampling can produce quality values significantly higher or lower than the true quality. Furthermore, the total tonnage produced during this 24-hour period was approximately 40 tonnes. To meet COP (Code of Practice) sampling requirements for this time frame (20 kg sample every 15 tonnes) 3 samples would have to be taken (which would represent only 0.15% of the throughput). From our analysis as depicted in the graph, 3 single data points would not be sufficient to truly illustrate the true purity and variability of the purity over this given timeframe.
Importance of understanding true average and variance of waste
For a MRF to maximise profits and minimise unnecessary costs, it is important to have an accurate reading of purity. Underestimating the true purity average of waste could leave MRFs losing out on selling their material at premium prices.
On the other hand, overestimating the true average purity of waste could lead to much worse financial implications. Graph 1 shows that the purity of bales produced in a day varies significantly - 89.22% - 95.09%. Not having a good understanding of the purity in all bales may result in selling contaminated bales. Selling contaminated bales may lead to rejected loads which may incur costs from transport, reprocessing, landfill taxes or fines.
As well as understanding the true purity of waste, understanding the true variation is also highly important for maximising value. By analysing graph 1, a MRF is able to recognise timeframes when purity is high and fairly steady (7pm - 10pm), as well as timeframes when purity drops or is inconsistent (12pm or 5pm - 6pm). Capturing the variability of purity in real time is important for spotting trends within short and longer timeframes. It allows MRFs to be able to connect drops in quality to factors such as low quality infeed, high volume/ dense throughput, downtime, machinery maintenance requirements, staff training requirements, fluctuations caused by time of day, seasons or destination of material infeed. Then, MRFs have the potential to take corrective actions in the moment and over time to rectify quality problems and unlock the true value of their waste.
Get in touch to find out more about how you too can unlock the financial of waste with continuous monitoring.
-1.png?width=501&height=285&name=webinar%20(1)-1.png)

.png?width=501&height=285&name=cover-2%20(1).png)