
There’s serious value in waste data – once it’s been unlocked by waste analytics software.
Tracking the objects that make up waste streams is just one part of the Greyparrot equation. Things get really exciting once you start looking at that data in our dashboard.
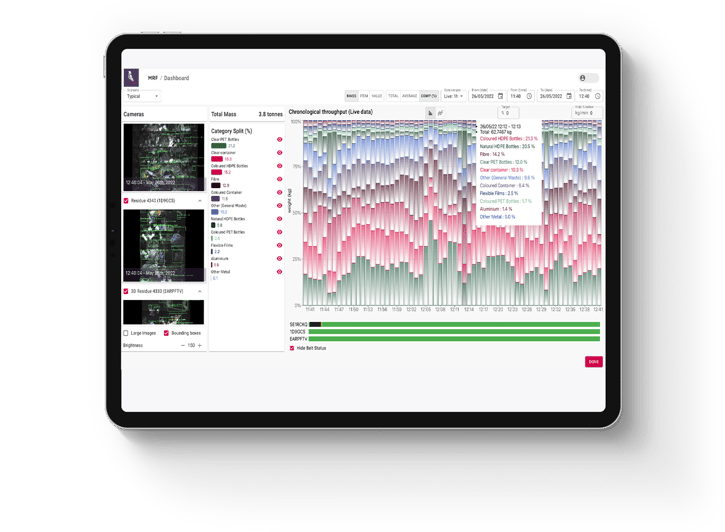
If you think of our AI monitoring unit providing an ‘index’ of material flows, then our dashboard is the insights generator. In other words, it’s the tool that aggregates thousands of data points into a meaningful output, giving you analytics for actionable insights.
Like any good software tool, our dashboard keeps evolving, and we’re adding new features all the time. Read on for a full breakdown of the following features, or click on any of them to skip ahead:
Each one will help to translate your waste data into financial value.
1. Customise our dashboard to your needs
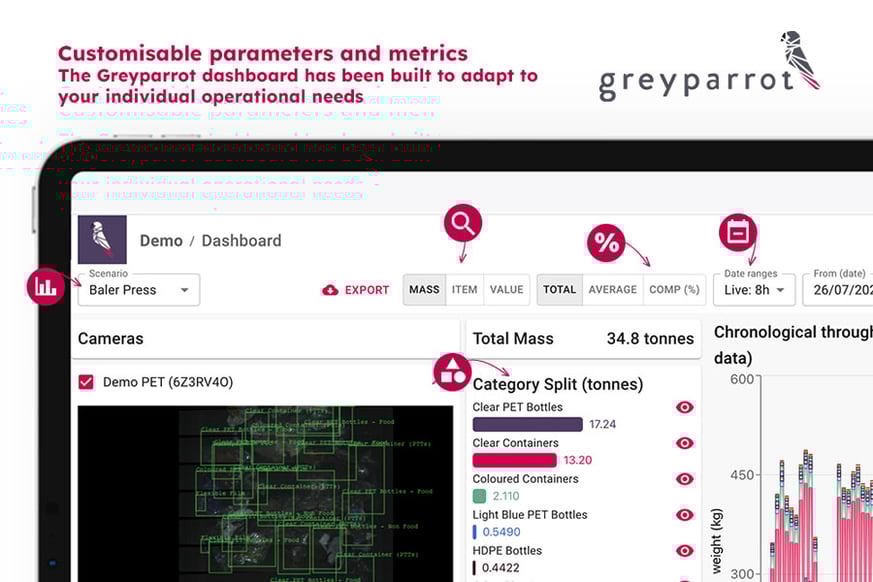
Before we get into specifics, it’s worth talking customisation – the guiding principle for all of our features.
We created the dashboard’s waste analysis building blocks, but you have the power to track them however you’d like. No two facilities are the same – they require (and prioritise) different metrics and benchmarks.
Flexible parameters mean that you can access the timelines, waste streams and material data that matters most.
What can you do?
A better question might be: what do you want to know about your waste streams? Here’s what you can customise.
- Surface the most relevant metrics at the top of your graph. From mass estimation and item count to financial value, in total or average amounts ⚖️,
- Set timeframes to analyse your material data in real-time or in retrospect, on a yearly, monthly, weekly, daily or even minute-by-minute level 🕓,
- Filter out low throughput to easily exclude irrelevant or non-representative data in your analysis 📊,
- Highlight the status of conveyor belts across your facility to continuously monitor your plant operations and quickly link drops in productivity with downtime ⚙️,
- Bring your team on board by adding users and customising access permissions on an individual level 👥,
- Define your use case and the analysis needed for each of your waste streams by setting scanarios and thresholds ✅
Why that's valuable
Whether you’re interested in operational data or need to use the dashboard for commercial analysis, our customisable parameters have every use case covered. That’s especially valuable if you’re part of a larger team with different requirements!
2. Track the financial value of your material
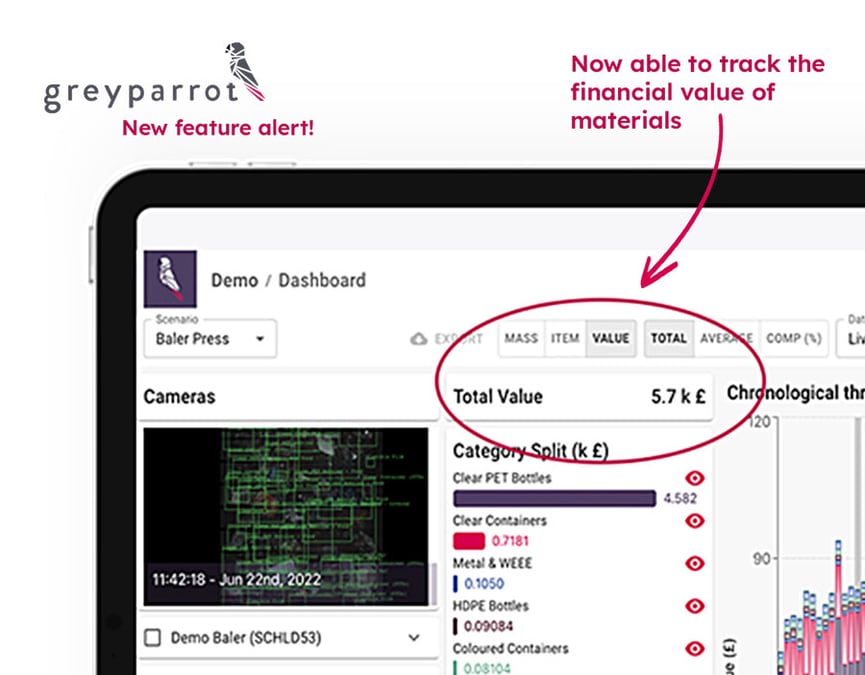
Do you know how much money is in your facility right now? What about the valuable material you’re losing to residue lines on a daily basis?
It’s not a hypothetical question. In just one PRF, our dashboard helped to uncover £1.6 million of material being lost to landfill every year. That’s why we introduced the value metric, to give operators visibility into the value they could be extracting from their waste streams.
What can you do?
Our system recognises over 49 materials, and the price-per-tonne varies widely. PET won’t cost as much in one country as it does another, and prices change over time. To keep things accurate, we’ve made it possible for you to enter a price-per-tonne for each material that’s accurate to your market.
Why that's valuable
Once that’s done, you can start analysing financial value in real time! It unlocks the ability to:
- Follow trends in material value 💰,
- Avoid future losses 💸,
- Invest in facility improvements that pay for themselves ✅.
It’s a feature that’s designed to give a measure of ROI to inform important financial decisions.
3. Control your operations with thresholds and alerts
Traditional sampling methods only surface 1% of your waste stream composition and is done on an ad-hoc basis. In other words, if your plant relies entirely on manual sampling, you are missing real-time information on fluctuations in the composition of the waste you’re processing, buying and selling.
What can you do?
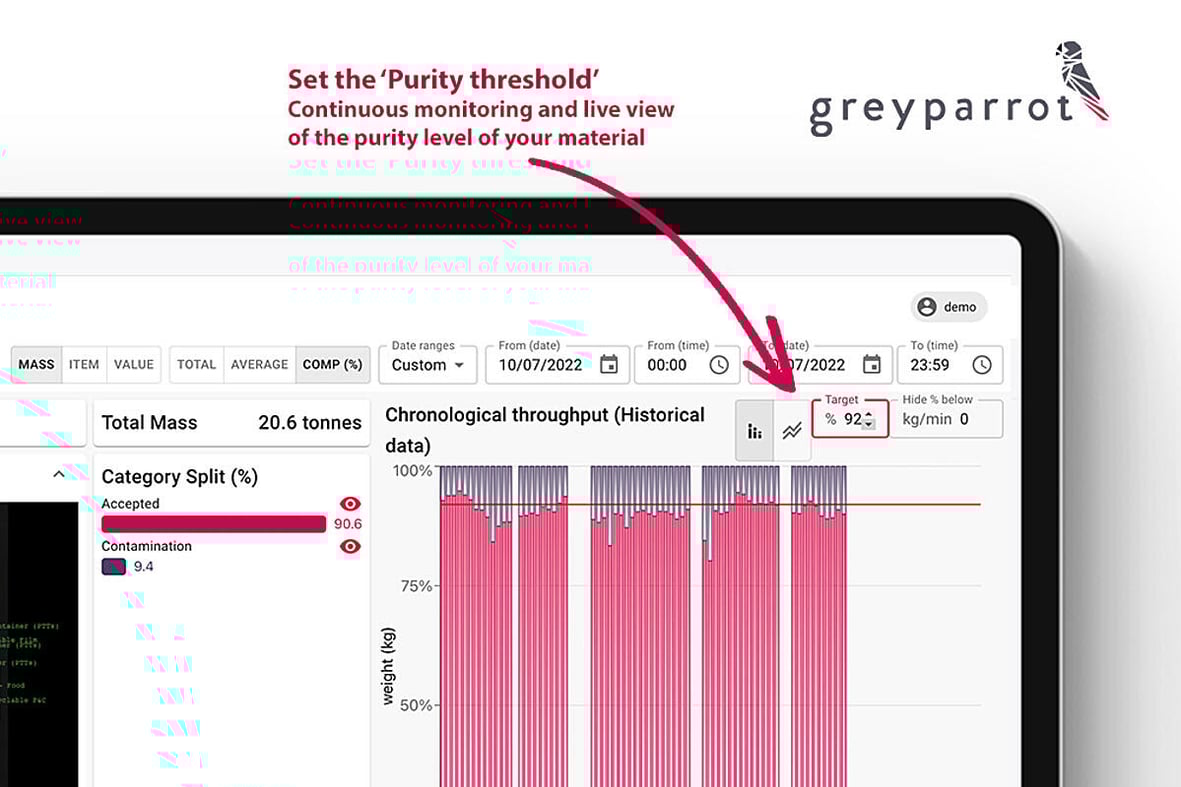
Our monitoring unit tracks 100% of waste stream composition, and sends that data to the dashboard in real-time. By selecting the materials you want (and don’t want), you can translate that data into an accurate breakdown of composition.
Once they're defined, you can monitor waste composition live at a glance with a helpful guideline overlaid on your data.
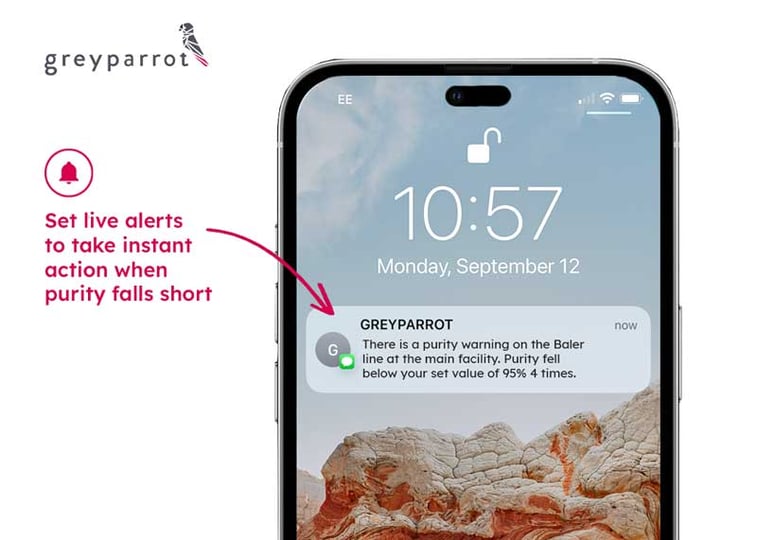
- Notify selected staff as soon as purity drops below a set level (i.e. 90%) and get instant feedback on the impact your tweaks have made ⚠️,
- Alert staff to pre-defined anomalies to mitigate its impact. For instance, you can act as soon as target material rises above a certain % in the residue line 🚨,
- Customise notifications to send alerts as soon as an issue arises, or receive daily updates via Email or SMS 📩,
- You can also view a log of incidences to keep track of unusual activity 🕵️
Why that's valuable
Faster issue resolution means less downtime. You’ll get a more granular understanding of your own operations, too. Use the alerts to track unusual fluctuations in your waste streams and spot trends in throughput density, time of day or year, staff scheduling, infeed source, and more.
4. Tailor reports and export data for analysis
While real-time data is invaluable, it’s also important to take snapshots of performance for deeper analysis.
What can you do?
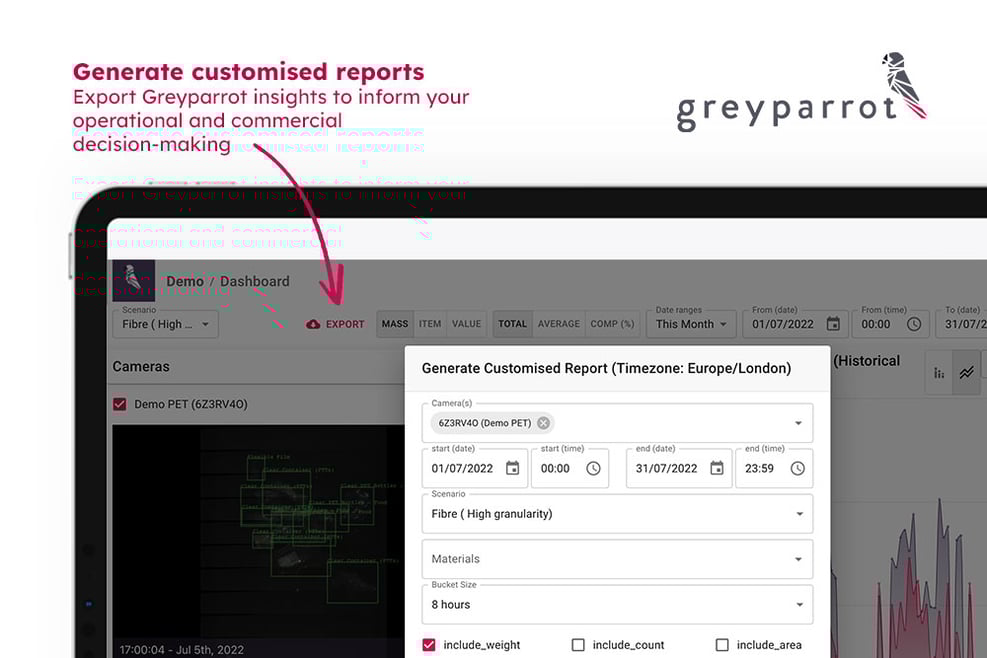
- Generate custom reports with a couple of clicks. Tailor your reports to the waste streams, time frames, metrics and materials that are most relevant 📜,
- Export as CSV files for easy distribution and further analysis ⬇️,
- Custom reports only require a few clicks, but those clicks quickly build up if you’re exporting on a regular basis. Use our automated reporting features to save time on recurring reports 🤖,
- You can choose how often you'd like stakeholders to receive reports with automated report distribution. Keep your team up-to-date – without ongoing effort 📩
Why that's valuable
With regular, accurate reporting, it’s possible to:
- Cross-check sampling results against our data to track manual sampling accuracy,
- Proactively manage staff training and machinery maintenance,
- Diagnose factors affecting downtime,
- See the impact of a machine blockage on operations,
- Assess plant performance two months ago versus today.
In short, it allows you to take stock of the thousands of data points you’re collecting, and use them to track against your KPIs - taking a data-first approach to operations.
See our waste analytics software in action
There’s a lot to take in, especially as we’re adding new features all the time.
To help keep our customers up to date, they get access to our Knowledge Hub – a collection of tutorials and guides covering hardware installation, dashboard features and FAQs. For everything else, there’s our dedicated support team.
If you want to see how all those parameters, metrics and reports relate to one another, the best way to do it is by booking a live demo. Tell us what you want to know about your facility, and we’ll show you how to surface it.
.png?width=501&height=285&name=Events%20social%20card%20(5).png)

-1.png?width=501&height=285&name=webinar%20(1)-1.png)